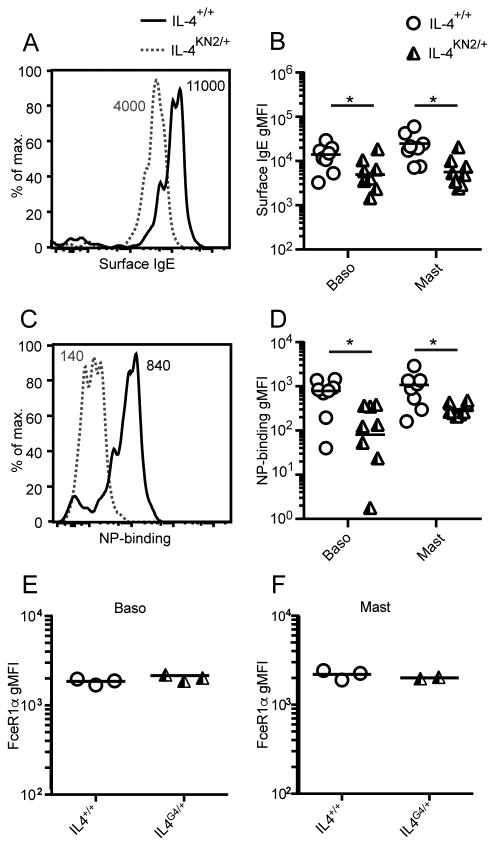
Figure 3. Basophil and mast cell sensitisation in Il4-hemizygous mice.
Basophils and mast cells were isolated from the immunised Basoph8 mice from Figure 2. A & C show representative flow analysis of basophils, B & D respectively show the geometric mean fluorescence intensity (gMFI) of IgE and NP-APC on both basophils and mast cells. C57BL/6J IL-4+/+ and IL-4G4/+ mice were immunised i.d. in the ear pinnae with NP-OVA/Alum and the gMFI of FceR1α on splenic basophils (E) and peritoneal mast cells (F) measured 7 days later. Data points show individual mice combined from two similar experiments (n=3-5 mice/group) in B and D and a single experiment (n=2-3 mice/group) in E and F, while lines show geometric means. Numbers on FACS histograms indicate sample gMFI. *p≤0.05 two-tailed Student's t-test after log transformation.

