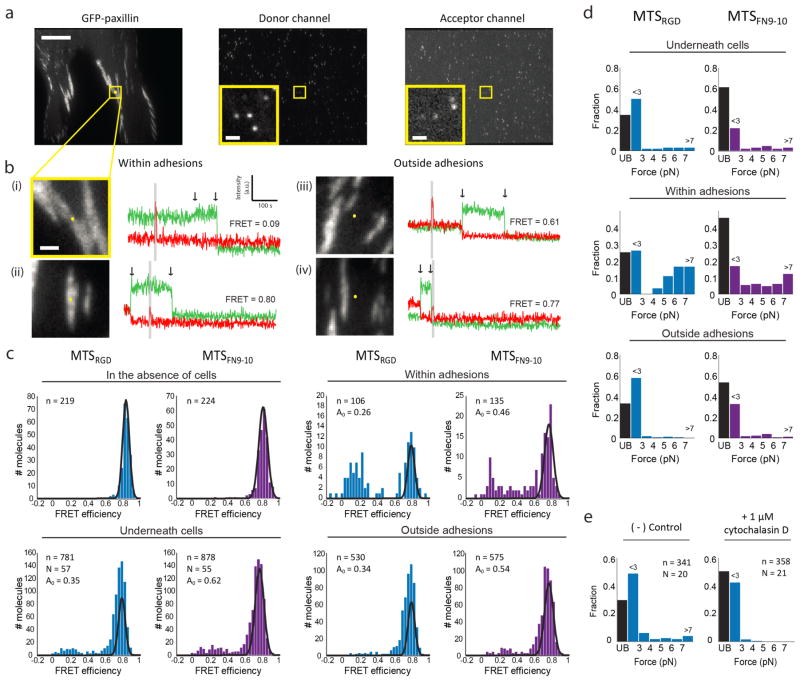
Figure 2. MTSs measure the forces exerted by single integrins within adhesions in living cells.
a) Representative images of the GFP, donor, and acceptor channels for a GFP-paxillin expressing HFF spread on a coverslip prepared with a single-molecule density of labeled MTSFN9-10. Scale bar = 10 μm. Yellow squares indicate a region of interest (insets plus bi). Inset scale bar = 1 μm. b) Four GFP-paxillin images with the tracked MTSFN9-10 location marked as a yellow dot. The corresponding single molecule fluorescence traces are shown to the right. The first arrow indicates acceptor (red) bleach and donor (green) recovery; the second arrow indicates donor bleach. Gray zones correspond to direct excitation of the FRET acceptor. Excitation at 635 nm increases the fluorescence background, which results in a small increase in counts in the acceptor emission channel in traces ii and iv. Examples traces include MTSFN9-10 molecules within adhesions (i, ii) and outside adhesions (iii, iv), with low (i, iii) and high (ii, iv) FRET values. c) FRET efficiency histograms for MTSRGD (blue) and MTSFN9-10 (purple) measured in the absence of cells, underneath cells, within adhesions, and outside adhesions. Black curves represent single-Gaussian fits to the no-load distributions (in the absence of cells), and to A0, the proportion of the distribution corresponding to unbound sensors obtained from a 3 Gaussian fit to the data in the presence of cells (see Supporting Information). d) FRET values from c converted to forces. Black bar (UB, unbound) indicates the fraction of MTS molecules that are assigned as not bound to an integrin. e) FRET efficiency values converted to forces for MTSRGD molecules measured underneath cells before (left) and after (right) treatment with 1 μM cytochalasin D. n = number of molecules, N = number of cells.

