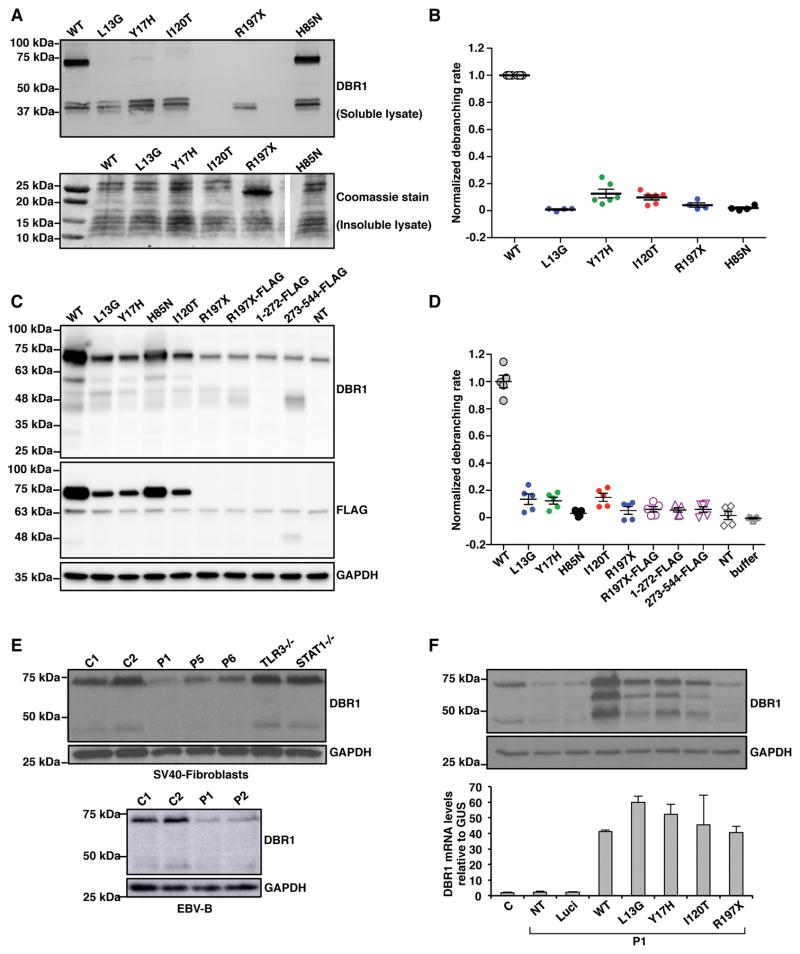
Figure 2. Impaired production and function of the patient-specific DBR1 mutant proteins.
A) Wild-type (WT) and mutant DBR1 protein levels in E. coli. Levels of WT, L13G, Y17H, I120T or R197X DBR1 in the soluble fraction of lysates were assessed by western blotting (upper panel), with an anti-DBR1 polyclonal antibody (pAb). The lower panel shows a Coomassie-stained gel of the insoluble fraction of the lysate. B) Debranching activity of the WT and mutant DBR1 proteins in the soluble fraction of E. coli lysates. The results of 4–6 independent biological replicates are plotted. C) HEK293T cells were transfected with plasmids containing C-terminal FLAG-tagged WT, L13G, Y17H, I120T or R197X cDNA, R197X cDNA with FLAG-coding sequences inserted in-between amino acid positions 196 and 197 (R197X-FLAG), or plasmids encoding C-terminal FLAG-tagged a.a. 1-272 or aa. 273-544 DBR1. The cell lysates were analyzed for western blotting with an anti-DBR1 pAb and an anti-FLAG monoclonal antibody. D) Debranching activity of HEK293T cell lysates with and without transfection with various DBR1 constructs. E) DBR1 protein levels, as assessed by western blotting, in SV40-fibroblasts (upper panel) from healthy controls (C) and patients with biallelic DBR1 mutations (I120T/I120T for P1, Y17H/Y17H for P5 and P6). DBR1 protein levels in EBV-B cells (lower panel) from healthy controls, P1 and P2 with homozygous I120T DBR1 mutations. F) DBR1 protein and mRNA levels, as assessed by western blotting (upper panel) and RT-qPCR (lower panel), respectively, in SV40-fibroblasts from a healthy control, from P1 with and without stable transfection with a pTRIP-RFP vector without DBR1 cDNA, or with WT or mutant DBR1 cDNA. NT: non-transfected, Luci: luciferase plasmid. In C), E) and F), the internal expression control was GAPDH. Each experiment shown in E–F is representative of at least three independent experiments.
See also Figure S3.

