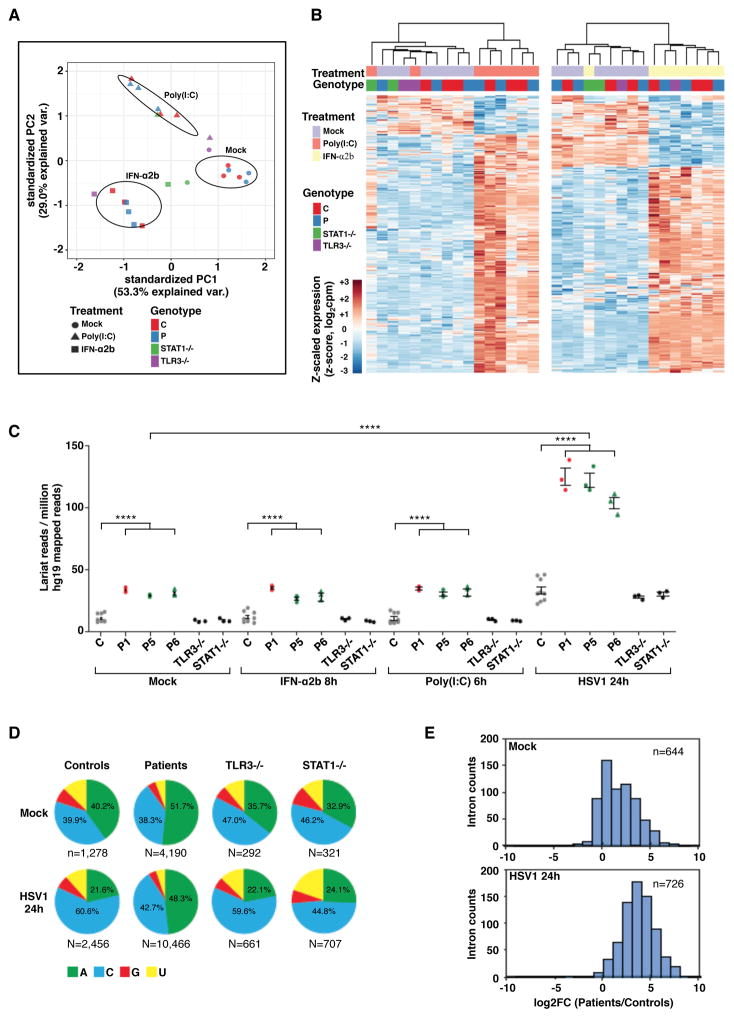
Figure 4. Intact TLR3- and IFN-responsive pathways, and very high RNA lariat levels in DBR1-deficient fibroblasts following HSV1 infection.
A) Principal component analysis (PCA) of RNA-Seq-quantified gene expression in primary fibroblasts from three healthy controls, three DBR1-mutated patients (P1, P5 and P6), one TLR3−/− and one STAT1−/− patient. Cells were mock-treated, stimulated with 25 μg/ml poly(I:C) for 6 hours, or stimulated with 100 IU/ml IFN-α2b for 8 hours. B) Heatmaps of RNA-Seq-quantified gene expression (z-score scaled log2 read counts per million, cpm) in primary fibroblasts from healthy controls, DBR1-mutated patients, TLR3−/− and STAT1−/− patients, with stimulations as described in A). Each heatmap includes genes differentially expressed (FDR 0.01, > 2-fold difference) in response to the indicated stimulus relative to mock-treated samples in the healthy control or DBR1-mutated groups. Hierarchical clustering (complete method) on Euclidean distance values. C) Lariat branchpoint-traversing read counts, obtained with the lariat read-count method and normalized against hg19 mapped read pairs, for primary fibroblasts with or without stimulation with poly(I:C) or IFN-α2b as described in A), or 24 hours of infection with HSV1, for three healthy controls (C), three DBR1-mutated patients, and TLR3−/− and STAT1−/− patients. We performed t-tests to compare intronic RNA lariat levels in samples from patients or healthy controls after infection with HSV1 with the corresponding uninfected samples (p<0.0001 in each case). **** p<0.0001. D) An analysis of DBR1 specificity in ‘A’, ‘C’, ‘G’, and ‘U’ branchpoint nucleotide composition, for primary fibroblasts with or without 24 hours of infection with HSV1, for controls (C) and patients. Chi-square test was used to compare the proportion of ‘A’ to non-‘A’ branchpoints in aggregated control versus patient samples after infection with HSV1 (p<0.0001). E) Distribution of intronic read density enrichment for three healthy controls versus three DBR1-mutated patients, in the absence of infection (top) and after HSV1 infection (bottom).

