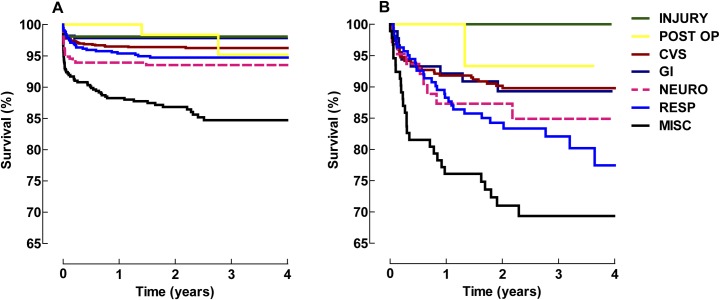
Fig 3.
Kaplan-Meier plots showing diagnostic group survival on single admission (a) and multiple admissions (b). There was a difference (p<0.001) between single and multiple admissions in all of the diagnostic groups except Inj and Post Op. Neuro displayed a p = 0.04. All p-values are presented in S2 Table.

