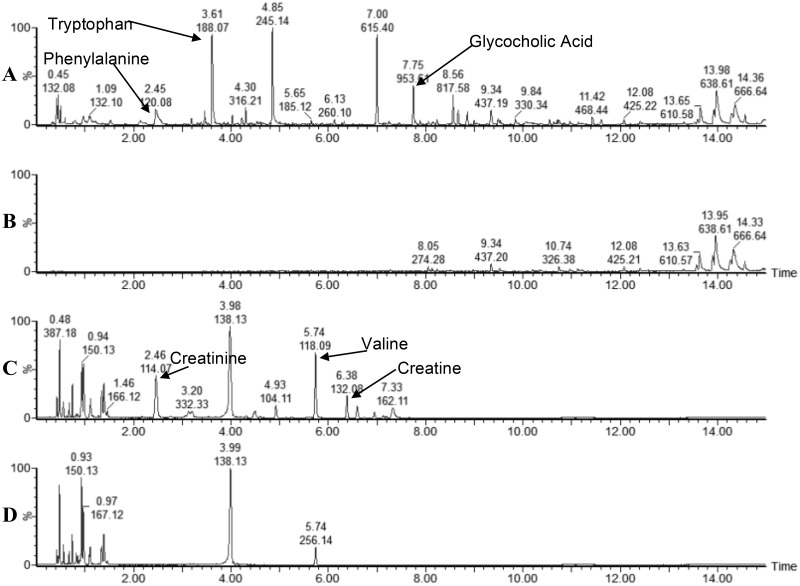
Fig 1. Baseline peak intensity chromatograms of RP and HILIC metabolomic profiled plasma at day 6 p.i.
(A and C) Plasma samples analysed by RP and HILIC respectively, (B and D) control injections (extractions performed without plasma) analysed by RP and HILIC respectively. Base peak intensity for plasma analysed by RP was limited to 80,000 counts to reduce the influence of tryptophan (3.61 min). Peaks from reference compounds (confirmed using pure standards) are indicated, tryptophan, phenylalanine and glycocholic acid for RP, and creatinine, creatine and valine for HILIC.

