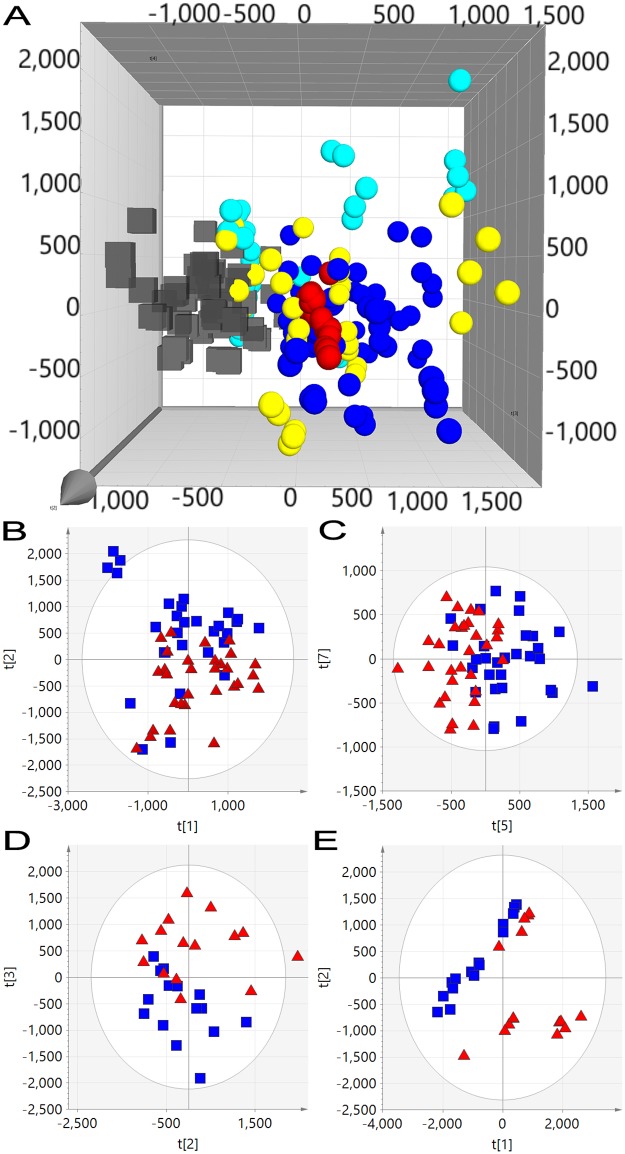
Fig 3. Unsupervised PCA scores plots of RP-UPLC-MS profiled plasma from vaccinated and non-vaccinated calves following BPI3V challenge.
(A) PCA analysis of pre- (black cubes) and post-BPI3V challenge (spheres) plasma metabolite profiles from vaccinated and non-vaccinated animals. (Blue sphere) day 2 p.i., (red sphere) day 6 p.i., (yellow sphere) day 14 p.i. and (turquoise sphere) day 20 p.i. Quality control plasma pools are indicated with green snowflakes. PCA scores plots of plasma from vaccinated and non-vaccinated calves at (B) day 0, (C) day 2, (D) day 14 and (E) day 20 p.i.

