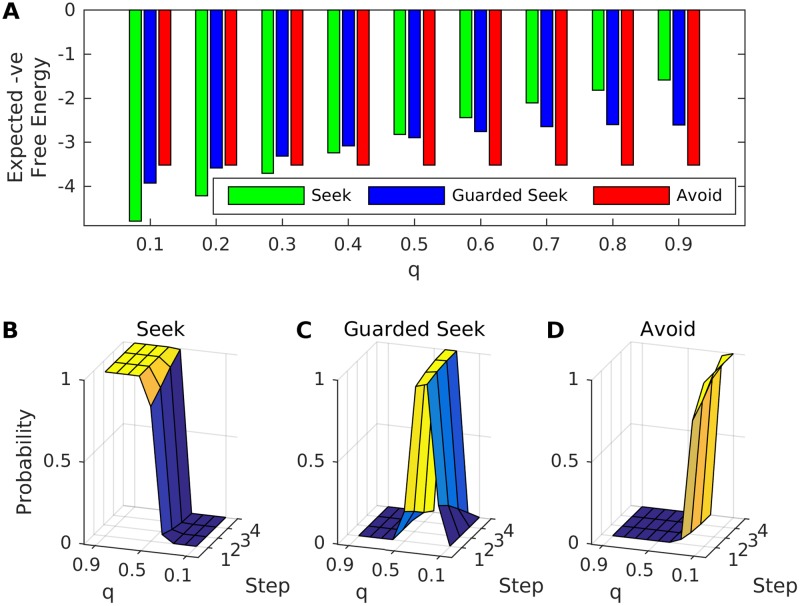
Fig 2. Expected negative free energies and action selection probabilities for perfect generative models.
The charts show expected negative free energies and action selection probabilities for an agent that has a perfect generative model of their environment (which is defined by parameters g = 2, h = 0.75, m = 2 and n = 0.9, and varying responsiveness q). A: Mean (over repetitions) expected negative free energies for Seek, Guarded Seek and Avoid on final step of free energy minimisation (y-axis), for different values of q (x-axis). B: Mean (over repetitions) action selection probabilities (z-axis) on each of the 4 steps of free energy minimisation (x-axis) for different values of q (y-axis) for Seek (C: Guarded Seek, D: Avoid).

