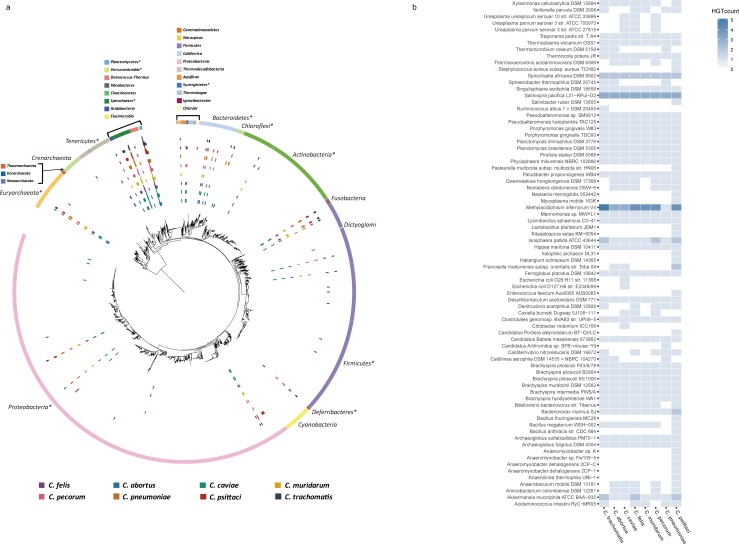
Fig 1. Donor organisms of HGT of 8 Chlamydia species.
(A) This figure illustrates a global pattern of HGT in 8 Chlamydia species analyzed. The phylogenetic tree of 2,472 prokaryotic species was constructed with FastTree (ver. 2.9) based on multiple sequence alignment of 16S rRNA. Tree was visualized using Interactive Tree of Life Version 3.4.3 (http://itol.embl.de/) [28]. Each colored strip of the outer circle represents different phylum of bacteria and archaea. The actual donor phylums are highlighted with asterisk. From inside out, circled bar charts represent C. abortus, C. caviae, C. felis, C. muridarum, C. pecorum, C. pneumoniae, C. psittaci, and C. trachomatis, respectively. Each bar chart shows the gene transfers from corresponding organism in the tree, and the vertical bars represent the number of HGT events between corresponding donors and recipient organisms. (B) Heatmap showing the number of HGTs between Chlamydia and non-chlamydial donor species. Rows represent all identified donor species (SV ≥ 0.9); Columns represent recipient Chlamydia species. Only HGT events have SV ≥ 0.9 are shown here.

