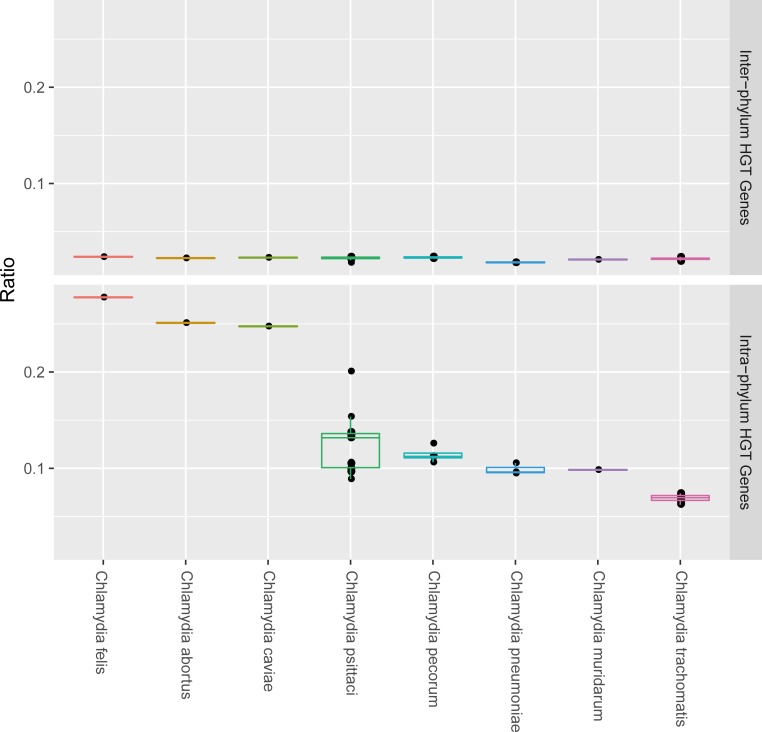
Fig 2. Distribution of the ratio of transferred genes of 64 chlamydial genomes.
Boxplots show the distribution of the ratio of transferred genes for organisms in each Chlamydia species. Each plot shows the distribution of ratios of transferred genes from organisms outside of Chlamydiae phylum (Top) and ratios of transferred genes from Chlamydia (Bottom). The x-axis indicates of 8 Chlamydia species used in this study, and the y-axis indicates ratio of the number of transferred genes in the number of total gene in each strain. The great amount of variability in the number of transferred genes between species is derived mainly from intra-phylum transfer events, on the other hands, the ratio of the inter-phylum transferred genes is shown consistently low across all strains.

