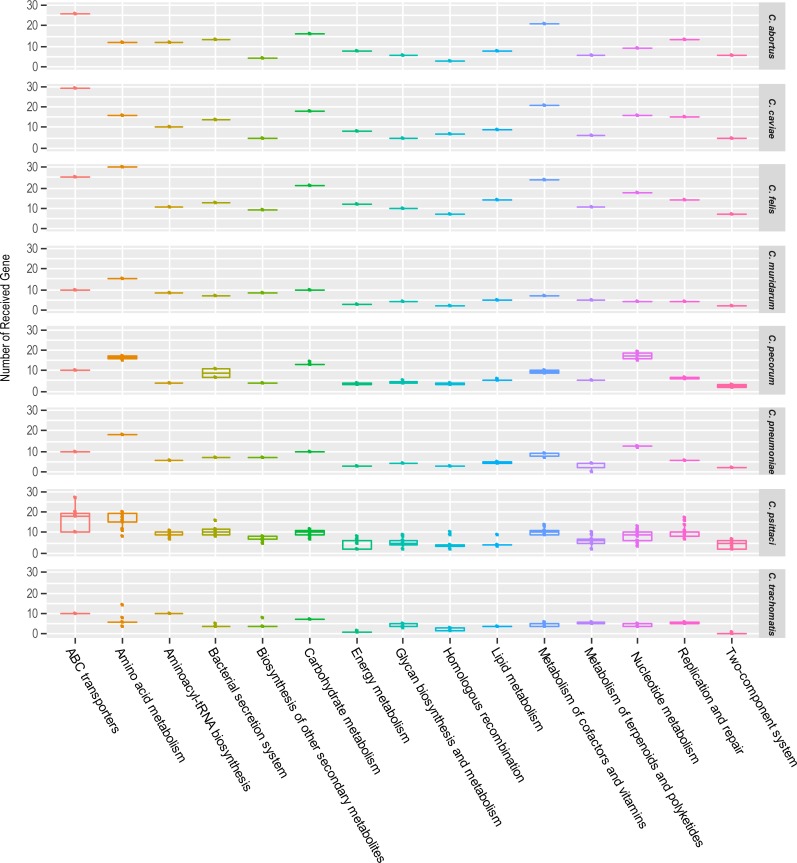
Fig 4. KEGG pathways of transferred genes of each Chlamydia species.
The figure displays variation in the number of transferred gene sets across KEGG Pathways. The Boxplots represent the number of genes associated in corresponding KEGG Pathway transferred to each Chlamydia species. Each row denote 8 different Chlamydia species used in this study. The y-axis indicates the number of genes transferred counted.

