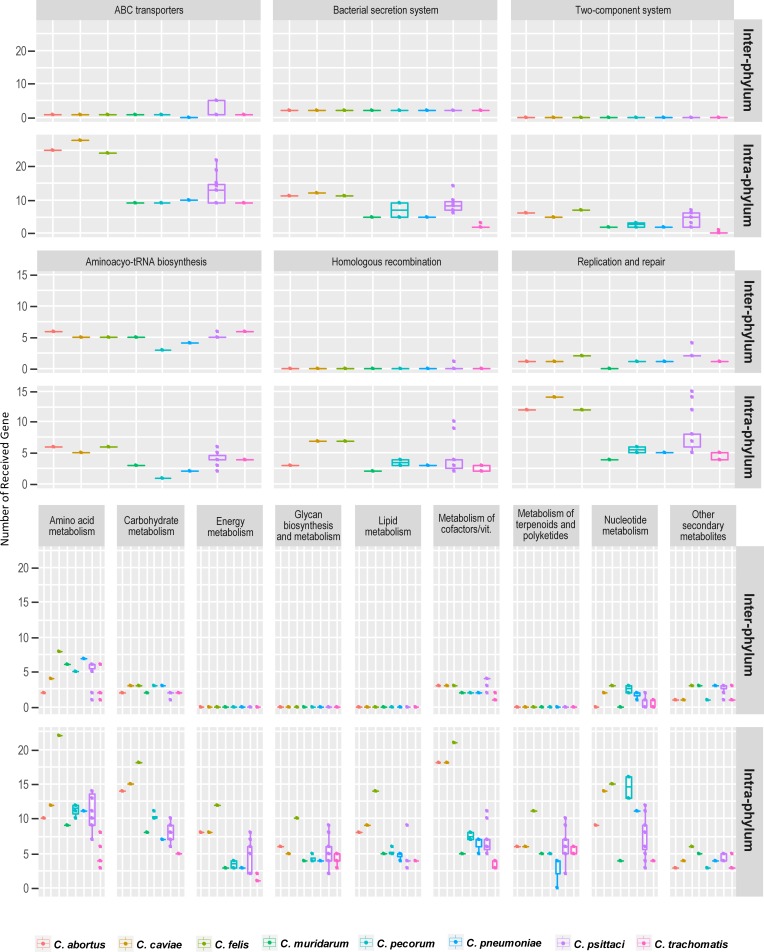
Fig 5. Distribution of number of the inter- and intra-phylum transferred genes across pathway.
The figure displays variation in the number of transferred gene sets between inter-phylum HGT and intra-phylum HGT. The Boxplots show the number of genes transferred to each Chlamydia species distributed across KEGG Pathways. Each row denotes inter- and intra-phylum HGT genes. The y-axis indicates the number of received genes to Chlamydia species counted.

