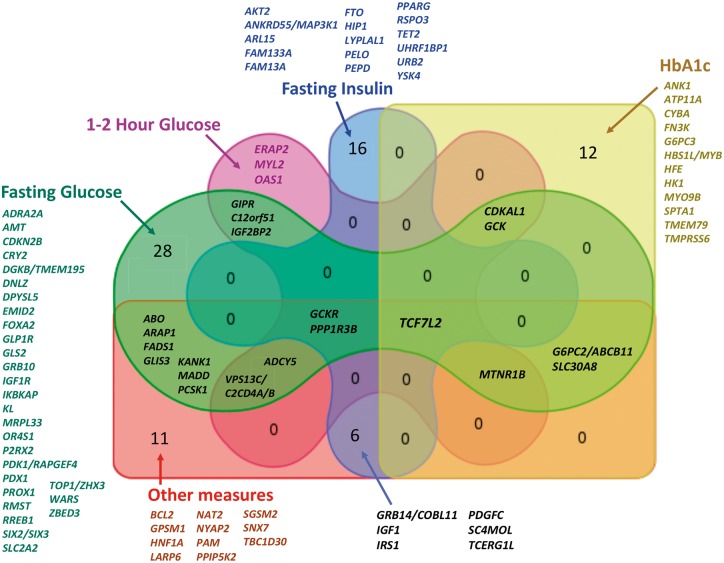
Figure 1.
Venn diagram showing the overlap between the groups of glycaemic loci identified. Lists of loci (identified by the name of the closest gene to the index variant, or biologically plausible gene where known) unique to each trait, or overlapping between traits, are listed outside the diagram where that number is high, otherwise they are indicated in the figure. Loci were identified from large-scale meta-analyses with N∼108–133 K for FI and FG and N∼43–48 K for 2hrGlu, HbA1c, and HOMA-IR. Sample sizes for other glycaemic measures were much smaller, ranging from N∼16 K for ISI to just ∼1,000 participants for 1hrGlu.

