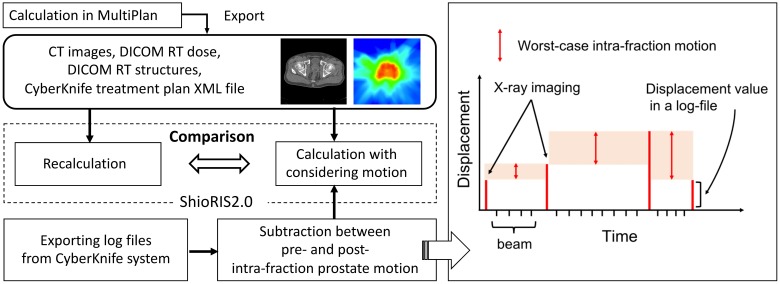
Fig 1. A schema of intra-fraction prostate motion simulation using log files.
A flowchart of intra-fraction prostate motion simulation using ShioRIS2.0 (left) and a diagram showing the worst-case intra-fraction motion during tracking irradiation based on log file analysis (right). The worst-case motion scenario that prostate had moved to the next detected position immediately after X-ray image acquisition was simulated by subtracting intra-fraction prostate motion between pre- and post-deviation on log files.

