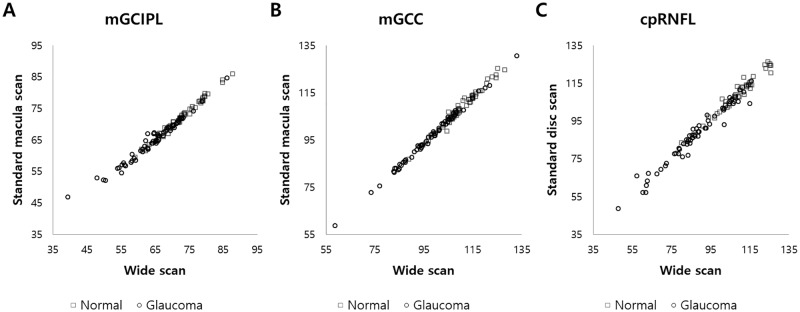
Fig 2. Dot plot graphs with the values from the wide and standard macular/disc scan measurements.
Total (average) thickness of (A) ganglion cell layer plus inner plexiform layer (mGCIPL) and (B) macular ganglion cell layer (mGCC), measured by wide scan (X axis) and standard macula scan (Y axis), and total (average) thickness of (C) circumpapillary retinal nerve fiber layer (cpRNFL), measured by wide scan (X axis) and standard disc scan (Y axis), in normal and glaucoma groups are shown.

