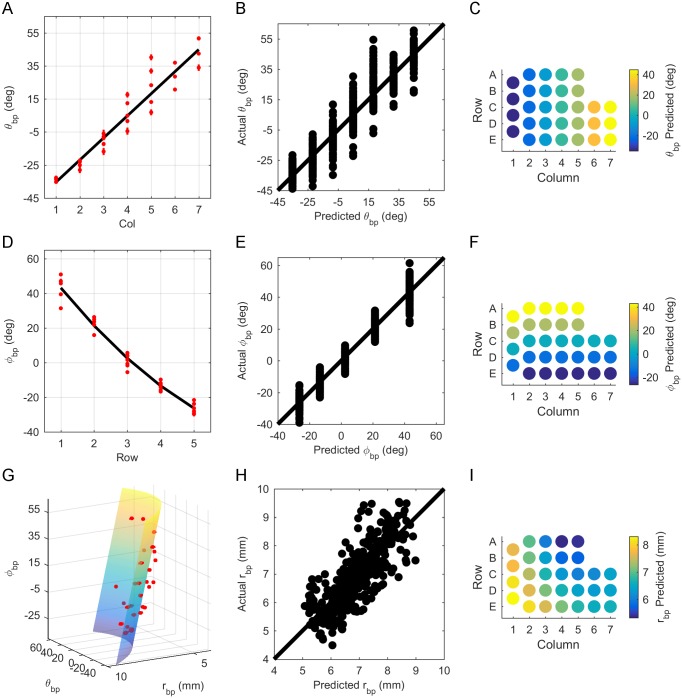
Fig 5. Relationship between basepoint parameters and row and column position on the array.
(A) θbp increases linearly with column identity (Col). The black line represents Eq 1. Red dots show average θbp when grouped by whisker identity, with the red bars representing standard error (SE). (B) Relatively uniform dispersion of actual vs. predicted values for θbp about the identity line indicates correct model choice for Eq 1. (C) Predicted variation of θbp by column (Eq 1) when grouped by whisker identity. (D) φbp decreases as Row increases. Eq 2 is shown as a black line. Red dots represent average φbp when grouped by whisker identity, where the red bars show SE. (E) Relatively uniform dispersion of actual vs. predicted values for φbp about the identity line indicates correct model choice for Eq 2. (F) Predicted variation of φbp with Row (Eq 2) when grouped by whisker identity. (G) rbp decreases with both θbp and φbp. Eq 3 is shown as a 3D surface. Plotting rbp on the y-axis and φbp on the z-axis demonstrates the approximate shape of the rat’s cheek. Red dots represent mean rbp when grouped by whisker, and red bars show SE. (H) Relatively uniform dispersion of actual vs. predicted values for rbp about the identity line indicates correct model choice for Eq 3. (I) Predicted variation of rbp with row and column (Eq 3) when grouped by whisker identity.

