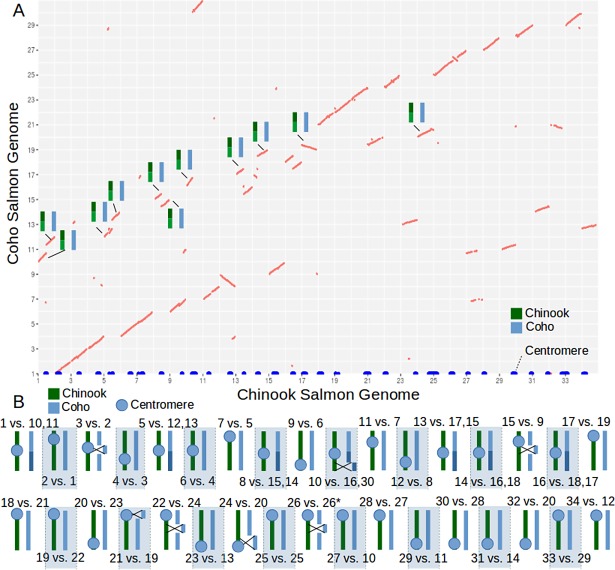
Fig 1. Comparison between Chinook and coho salmon genomes.
A) An alignment dotplot between the Chinook and coho salmon genomes after filtering nonlinear alignments. On the x-axis the centromere locations have been plotted for each chromosome (shown in blue). Coho fusions (relative to the most common ancestor) are illustrated on the dotplot by illustrations of chromosomes. B) A diagram depicting the Chinook fusions (and one coho fission on chromosome 8). The diagram has the approximate locations of the centromere, inversions between species, and labels of the chromosomes involved. *Inversion likely due to an assembly error in the coho reference genome.

