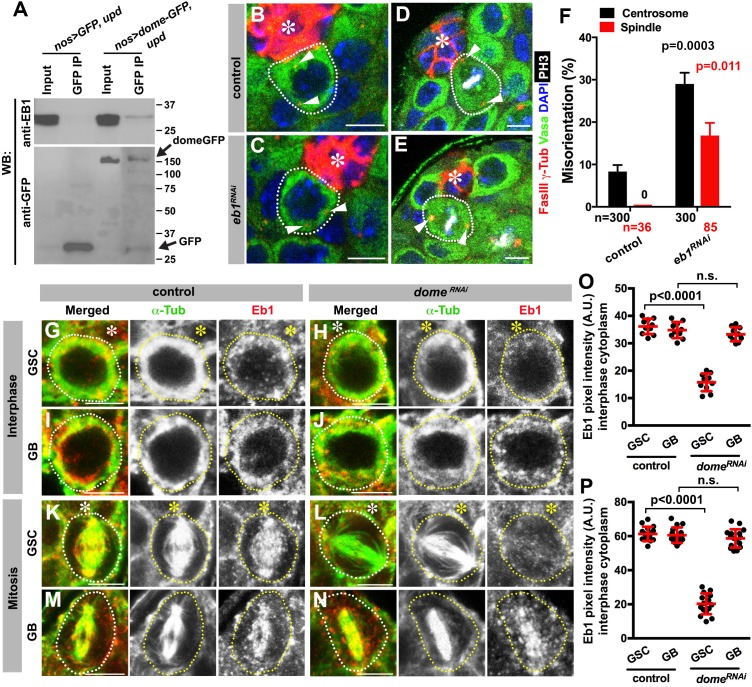
Figure 5. Eb1 binds to Dome and regulates GSC centrosome/spindle orientation.
(A) Co-immunoprecipitation of Dome with Eb1. Dome-GFP was pulled down from GSC extracts using an anti-GFP antibody and blotted using anti-Eb1 and anti-GFP. (B–C) Examples of centrosomes in control (B) and nos-gal4 > UAS-eb1RNAi (C) GSCs (outlined by a dotted line). Asterisk indicates the hub. Arrowheads indicate centrosomes. Green: Vasa. Red: Fas III and γ-Tubulin. Blue: DAPI. Bar: 5 µm. (D–E) Examples of mitotic spindles in control (D) and nos-gal4 > UAS-eb1RNAi (E) GSCs (outlined by a dotted line). Asterisk indicates the hub. Arrowheads indicate spindle poles. Green: Vasa. Red: Fas III and γ-Tubulin. White: PH3. Blue: DAPI. Bar: 5 µm. (F) GSC spindle orientation in the indicated genotypes. P value was calculated using two-tailed Student’s t-test. Error bars indicate the standard deviation. N = mitotic GSCs scored. (G–J) Eb1 localization in interphase control GSC (G), nos-gal4ΔVP16, gal80ts > UAS-domeRNAi (4 d after RNAi induction) GSC (H), control GB (I), and nos-gal4ΔVP16, gal80ts > UAS-domeRNAi (4 d after RNAi induction) GB (J). Asterisk indicates the hub. Green: α-Tubulin. Red: Eb1. Bar: 5 µm. (K–N) Eb1 localization in metaphase control GSC (K), nos-gal4ΔVP16, gal80ts > UAS-domeRNAi (4 d after RNAi induction) GSC (L), control GB (M), and nos-gal4ΔVP16, gal80ts > UAS domeRNAi (4 d after RNAi induction) GB (N). Asterisk indicates the hub. Green: α-Tubulin. Red: Eb1. Bar: 5 µm. (O–P) Pixel intensity analyses of Eb1 at interphase (O) and mitotic (P) GSCs in control and nos-gal4ΔVP16, gal80ts > UAS-domeRNAi (4 d after RNAi induction) testes. P value was calculated using two-tailed Student’s t-test. Error bars indicate the standard deviation.


