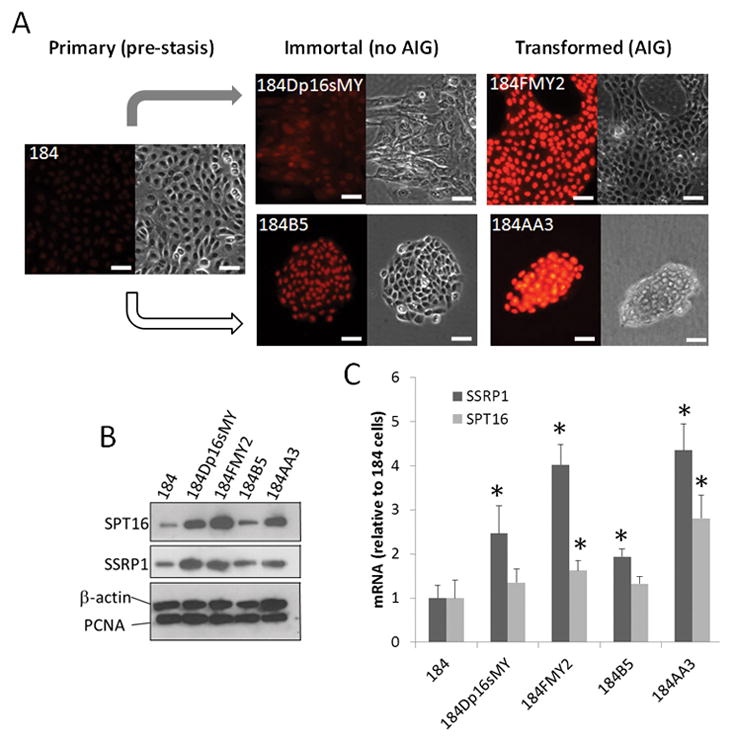
Figure 1.

FACT subunits levels are elevated in the process of transformation of HMEC using genetic (grey arrow) or chemical (white arrow) manipulations. Primary (184), immortal (184Dp16sMY, 184B5) and fully transformed (184FMY2, 184AA3) cells were assessed by (A) immunofluorescent staining with antibodies to SSRP1; (B) Western blotting with the indicated antibodies; and (C) qRT-PCR analysis of total RNA with primers specific to SSRP1, or SPT16 or 18S rRNA (loading control). Data in (C)were normalized based on the level of 18S rRNA and are shown relative to the level of the corresponding transcripts in 184 cells (set at 1.0). Bars indicate the mean of three replicates + SDV. * indicates p<0.05 for comparison to 184 cells. See also Fig. S1.
