
Figure 2.
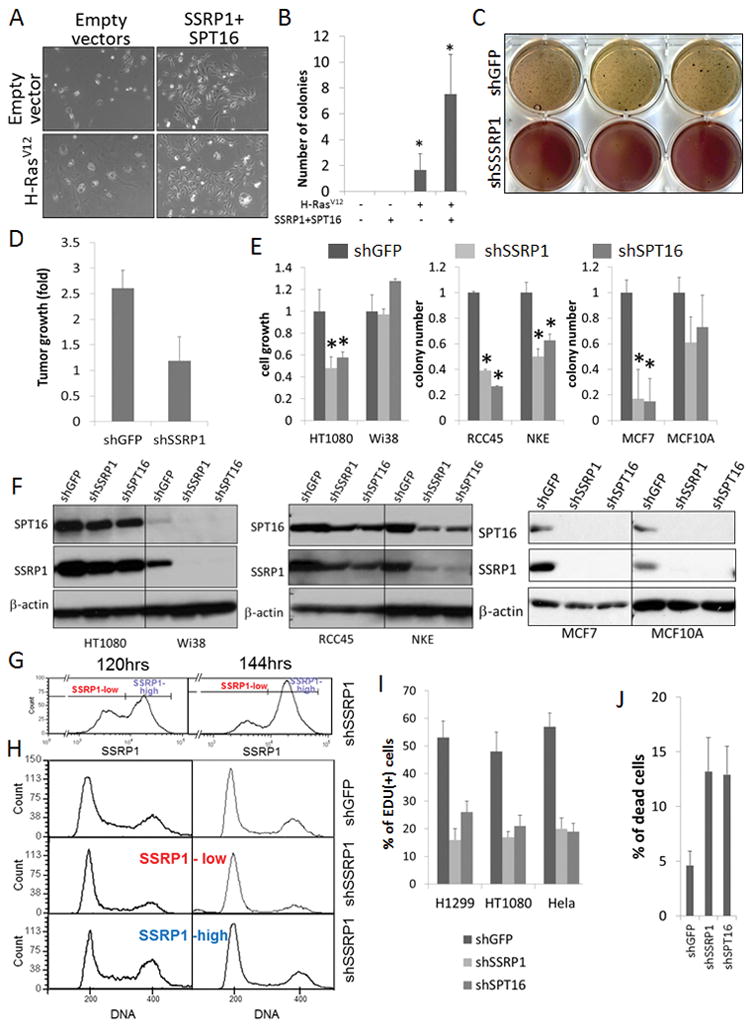
Transformation and tumor, but not normal, cell growth require FACT expression. A–B. Overexpression of FACT increases the efficiency of transformation of MCF10A cells by H-RasV12. A. Microphotographs of 2D colonies 6 days after transduction of cells with the indicated constructs. B. Number of colonies in semi-solid medium for cells transduced with the indicated constructs or empty vectors (-), the mean of triplicates + SDV; * indicates p<0.05 for comparison to cells transfected with both empty vectors. C–D. KD of SSRP1 suppresses H-RasV12induced transformation of MCF10A cells. C. MTT-stained colonies in semi-solid medium in triplicate wells grown for 37 days after transduction with shRNAs. The darker color of shSSRP1 wells is due to unreduced MTT. D. Growth of tumors (n=10) in SCID mice 30 days after inoculation of mice with MCF10A cells transduced with the indicated shRNAs (tumor volume at day 1 after inoculation =1). E. Growth of tumor (HT1080, RCC45, MCF7) and non-transformed (WI38, NKE, MCF10A) cells after shRNA transduction/puromycin selection. Bars show the means of triplicates of methylene blue staining (HT1080/Wi38) or colony number (RCC45/NKE, MCF7/MCF10A) +/− SDV, normalized to shGFP data in the same cell type. * indicates p<0.05. F. Western blot detection of FACT subunits in the cells described in E after puromycin selection. G. FACS analysis of SSRP1 staining in HT1080 cells 120 and 144 hrs after transduction with shSSRP1. H. Cell cycle distribution (FACS with DAPI staining) of HT1080 cells 120 (left column) and 144 hrs (right) after transduction with shGFP or shSSRP1, with the latter population separated based on SSRP1 staining as shown in G. I. EDU incorporation indicative of DNA replication 3 days after transduction of cells with the indicated shRNAs. * indicates p<0.05 for comparison to data with shGFP transduction in the same cells. J. Proportion of dead cells detected using Annexin V and propidium iodide staining (double positive) among HT1080 cells 5 days after transduction with the indicated shRNAs. See also Fig. S2.