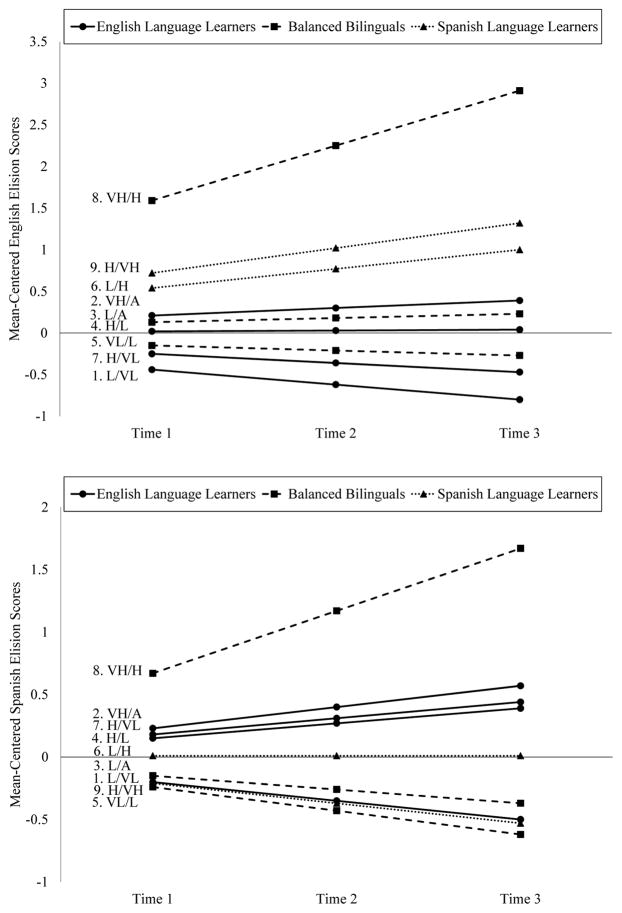
Figure 4.
Growth curves of English (4a) and Spanish (4b) elision skills over the course of the preschool year for each profile in the 9-profile model. VL = Very Low. L = Low. A = Average. H = High. VH = Very High. Sample-mean latent intercept and slope scores are zero; therefore, a positive slope represents faster than average growth relative to other children in this sample and a negative slope represents slower than average growth relative to other children in this sample.

