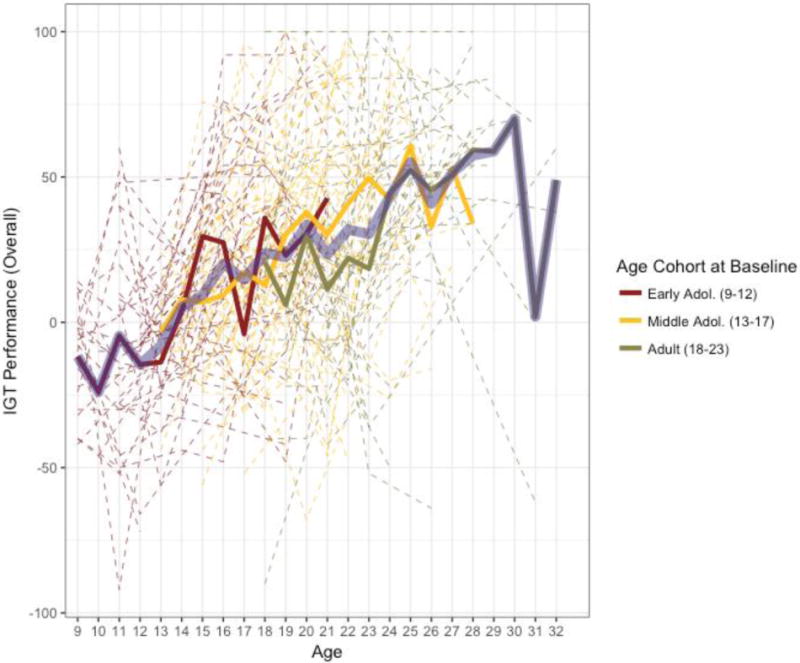
Figure 1.

Overall Iowa Gambling Task (IGT) performance for all subjects (dashed lines) during the study. The three opaque lines represent the average of a cohort at a given age. The transparent, purple line represents the average IGT performance at each age across cohorts. Adol. = adolescent.
