
Figure 2. Ion conduction pore of MmTPC1.
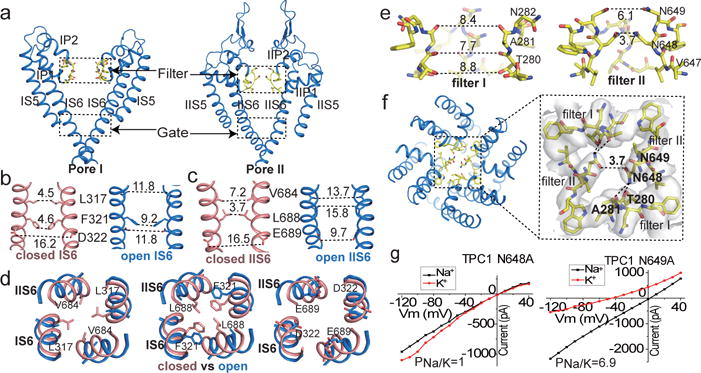
a, Ion conduction pore comprising IS5-S6 (pore 1) and IIS5-S6 (pore 2). b and c, Side view of the bundle crossing formed by IS6 (b) and IIS6 (c) in the apo closed (salmon) and PtdIns(3,5)P2-bound open (blue) states. Numbers are cross distances (in Å) at the constriction points. d, Structural comparison of the cytosolic gate between the closed and open states viewed from the cytosolic side in three sections: L317/V684 (left), F321/L688 (middle) and D322/E689 (right). e, Side view of the selectivity filter formed by filter I and filter II with the front subunit removed for clarity. f, Top view of the selectivity filter. Inset: zoomed-in view of the filter with the stabilization H-bonds for N648 (dotted line) and EM-density (grey) shown. g, Sample I–V curves of the filter mutations recorded with high Na+ or K+ in the bath solution. Original traces are shown in Extended Data Fig. 7. The experiments were repeated five times independently with similar results.