
Extended Data Figure 3. Structure determination of PtdIns(3,5)P2-bound MmTPC1.
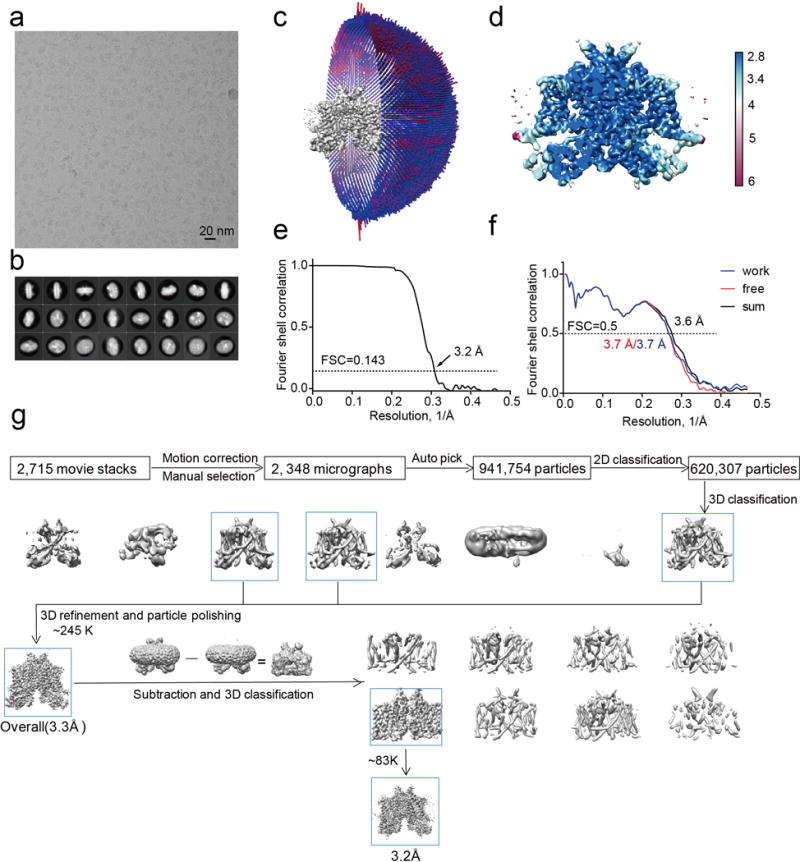
a, Representative electron micrograph of PtdIns(3,5)P2-bound MmTPC1 and 2348 micrographs were used for structure determination. b, Two-dimensional class averages. c, Euler angle distribution of particles used in the final three-dimensional reconstruction, with the heights of the cylinders corresponding to the number of particles. d, Final density maps colored by local resolution. e, Gold-standard FSC curves of the final 3D reconstructions. f, FSC curves for cross-validation between the models and the maps. Curves for model vs. summed map in black (sum), for model vs. half map in blue (work), and for model vs. half map not used for refinement in red (free). g, Flowchart of EM data processing for PtdIns(3,5)P2-bound MmTPC1 particles.