
Extended Data Figure 9. PtdIns(3,5)P2 binding in MmTPC1.
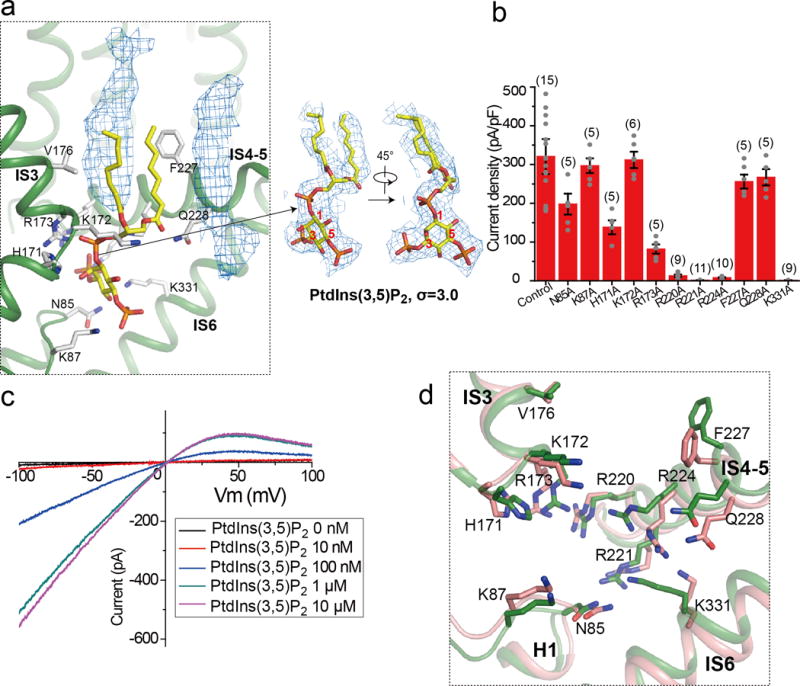
a, Model of bound PtdIns(3,5)P2 (left panel) and its EM density (right panel). Density of two other membrane lipid molecules (blue mesh in the left panel) was also observed near PtdIns(3,5)P2 in the structure. b, Current density of mutations at the PtdIns(3,5)P2-binding site measured at −100 mV in whole cell recordings. All mutants were generated on the background of Arg540Gln mutant which is used as control. All data points are mean ± SEM with the number of independent experiments for each mutant shown in bracket. c, Sample I-V curves of Arg540Gln mutant recorded in excised patches with varying PtdIns(3,5)P2 concentrations in the bath (cytosolic). The experiments were repeated five times independently with similar results. Currents at −100mV were used to generate the concentration dependent PtdIns(3,5)P2 activation curve shown in Figure 4c. Imax is the current recorded at −100 mV with 10 μM PtdIns(3,5)P2 in the bath. d, Structural comparison at the ligand binding site between the PtdIns(3,5)P2-bound (green) and apo (salmon) states.