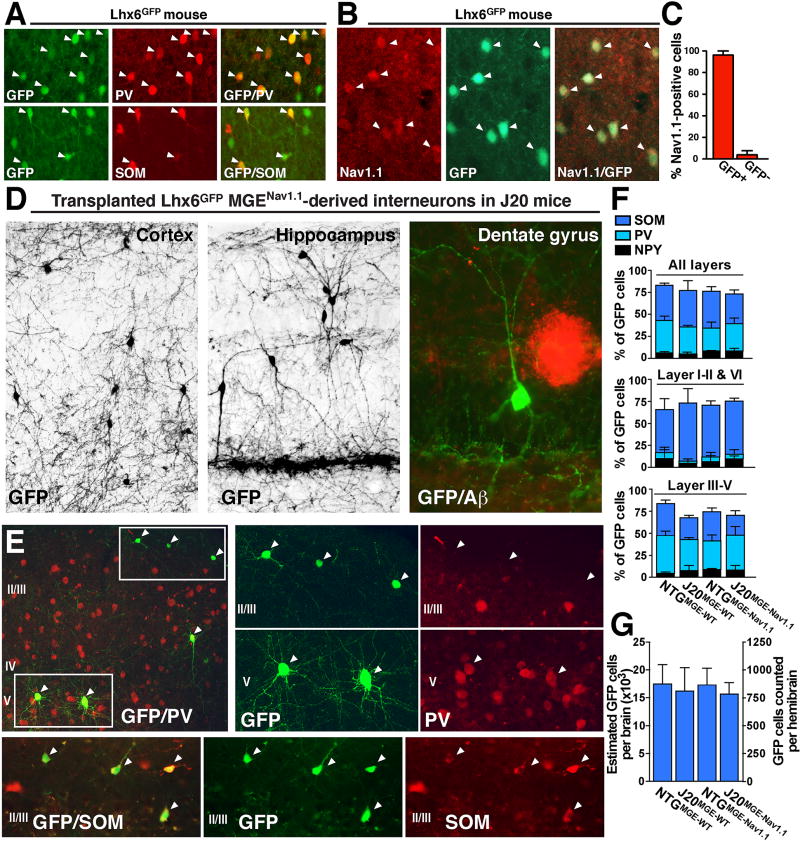
Figure 1. Transplanted MGE-derived precursors generate Nav1.1-expressing inhibitory interneurons in host NTG and J20 brains.
(A) Double-labeling for GFP (green) and PV (red, top) or SOM (red, bottom). GFP is expressed by PV (top) and SOM (bottom) inhibitory interneurons in Lhx6GFP mice. Arrowheads indicate double-labeled cells.
(B) Double-labeling for Nav1.1 (red) and GFP (green). Nav1.1 is predominantly expressed by Lhx6GFP inhibitory interneurons. Arrowheads indicate double-labeled cells.
(C) 97% of Nav1.1-positive cells were Lhx6GFP interneurons (n = 4 mice, 104 cells). (D) GFP-positive interneurons that were derived from Lhx6GFP MGENav1.1 precursor cells transplanted into 3–5-day-old J20 mice 7–8 months before analysis had mature morphology and extensive axonal and dendritic arborizations. At 7–8 months of age, J20 mice had Aβ-positive plaques (red).
(E and F) MGE-derived interneurons predominantly expressed PV or SOM and were distributed in typical subtype-specific fashion across cortical layers. (E) Double-labeling for GFP (green) and PV (red, top) or SOM (red, bottom). Transplanted GFP-positive PV cells were predominantly in intermediate cortical layers (top, layer V), whereas GFP-positive SOM cells were predominantly in superficial cortical layers (bottom, layer I). (F) Proportions of MGEWT- and MGENav1.1-derived interneurons in different cortical layers in NTG and J20 mice expressing PV, SOM, or neuropeptide Y (NPY) (n = 4 mice per group, 1449 GFP-positive cells).
(G) Number of MGEWT- and MGENav1.1-derived interneurons in NTG and J20 mice (n = 6–11 mice per group, 21696 GFP-positive cells).
Values are mean ± SEM. See also Figures S1 and S2.

