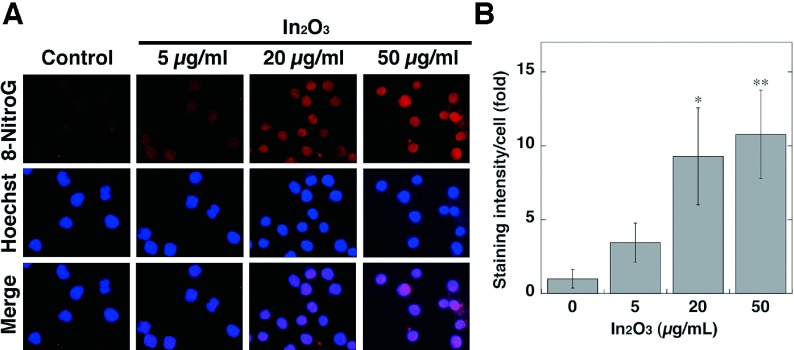
Fig. 3.
8-NitroG formation in In2O3-treated cells. (A) Immunofluorescent images of 8-nitroG formation in In2O3-treated cells. RAW 264.7 cells were treated with indicated concentrations of In2O3 for 4 h at 37°C. 8-NitroG formation was detected by immunocytochemistry as described in Materials and Methods section. The nucleus was stained with Hoechst 33258. Magnification, ×200. (B) Quantitative image analysis of 8-nitroG formation in In2O3-treated cells. The staining intensity per cell was quantified with an ImageJ software. The vertical axis shows the fold increase in the staining intensity compared with that of the control, which was set at 1. The data were expressed as means ± SD of 3-4 independent experiments. *p <0.05 and **p <0.01 compared with the control by ANOVA followed by Tukey’s test.

