Fig. 2.
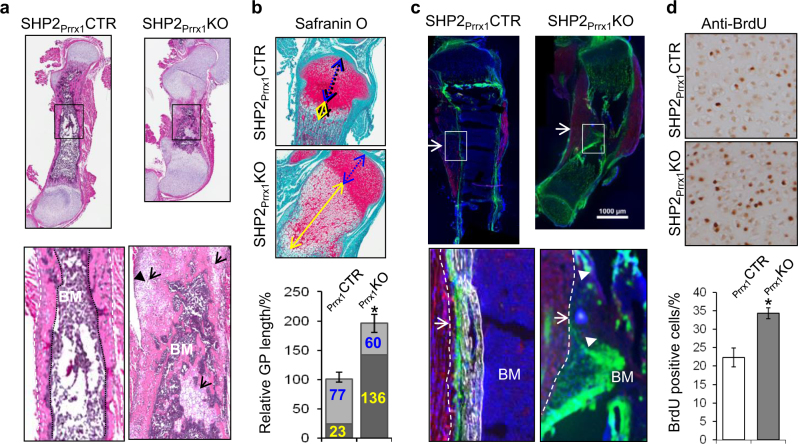
SHP2 deficiency in PRRX1-expressing OCPs delays endochondral ossification and leads to ectopic cartilage formation. a Representative images of H&E-stained longitudinal sections of femurs demonstrate impaired ossification of appendicular bones, enhanced chondrogenesis and ectopic cartilage formation in 7-day-old SHP2Prrx1KO mice, compared with SHP2Prrx1CTR Mice. Bottom panels are enlarged views (×10) of corresponding boxed areas in the top panel showing ectopic chondrocytes in the bone cortex and islands of chondrocytes in the bone marrow (BM, arrow) of SHP2Prrx1KO mice (n = 4). b Images of sagittal sections of proximal tibiae (top), stained with Safranin O/fast green, showing the broad and elongated growth plate cartilage in SHP2Prrx1KO mice. Bar graphs (bottom) show 2- and 5-fold increases in height of the epiphyseal cartilage (blue+yellow lines) and the pre-hypertrophic and hypertrophic layers, (yellow line) respectively, in SHP2Prrx1KO mice, compared with SHP2Prrx1CTR mice (n = 4). *P < 0.05 (Student’s t test). c Fluorescence microscopy of frozen tibia sections demonstrates that PRRX1-expressing cells (GFP+) primarily exist as a thin layer (periosteum, arrow) on the surface of the mineralized bone cortex and also appear in the epiphyseal cartilage of 2-day-old SHP2Prrx1CTR;R26mTmG reporter mice. By contrast, in age-matched SHP2Prrx1KO;R26mTmG mice, there was no mineralized cortical bone, and the GFP+ cells were not restricted to the thin periosteal soft tissue layer along what would have been the cortex (arrows). Instead, GFP+ OCPs and their derivatives were scattered in non-mineralized areas where cortical bone should have formed and in cartilage islands within the bone marrow (arrow head) (n = 4). Bottom panels are enlarged views (×10) of the corresponding boxed areas in top panels. Dashed lines denote the boundary between muscle and bone. Bone marrow, BM. d Images of anti-BrdU staining of proximal tibia sections demonstrate the increase of BrdU+ cells in the proliferative zone of SHP2Prrx1KO mice, compared to that of SHP2Prrx1CTR. Bar graphs at the bottom show quantification of these data from replicates (n = 3, *P < 0.01, Student’s t test).

