Fig. 3.
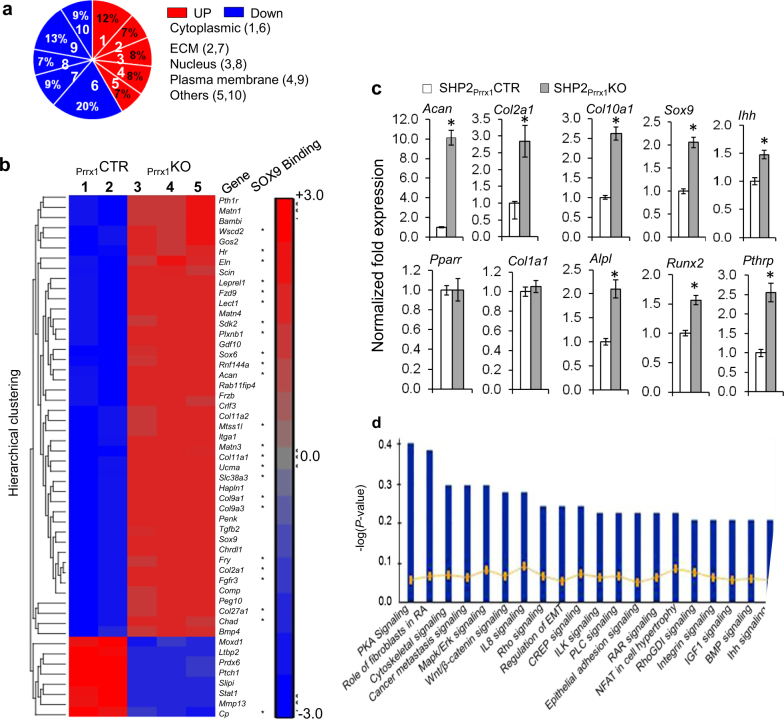
SHP2 negatively regulates chondrocytic gene expression a Pie chart demonstrating the clusters of genes that are differentially regulated by SHP2 in OCPs and their derivatives. Cytoplasmic, cytoplasmic proteins, ECM, extracellular matrix proteins; Nucleus, nuclear proteins and transcription factors. b Heat map and list of selected chondrogenic genes that increased or decreased in abundance following Ptpn11 deletion in OCPs and derivatives. Note that most of chondrocytic genes that increased in abundance harbor SOX9 binding sites (asterisks). c Bar graphs of qRT-PCR data showing the enhanced expression of Acan, Col2α1, Col10α1, Sox9, Ihh, Runx2, and Pthrp in OCPs and their derivatives from SHP2Prrx1KO mice, compared with SHP2Prrx1CTR controls. PPARγ and Col1a1 transcripts are comparable between these animals. Data are presented as the fold changes of mRNA abundance relative to the corresponding controls. All samples are normalized to Gapdh (n = 3, *P < 0.01, Student’s t test). d Bar graphs depicting the top 20 cellular signaling pathways predicted to be substantially affected by Ptpn11 deletion in OCPs and their derivatives by Ingenuity Pathway Analysis. Note that PKA signaling pathway was at the top of all affected signaling pathways.

