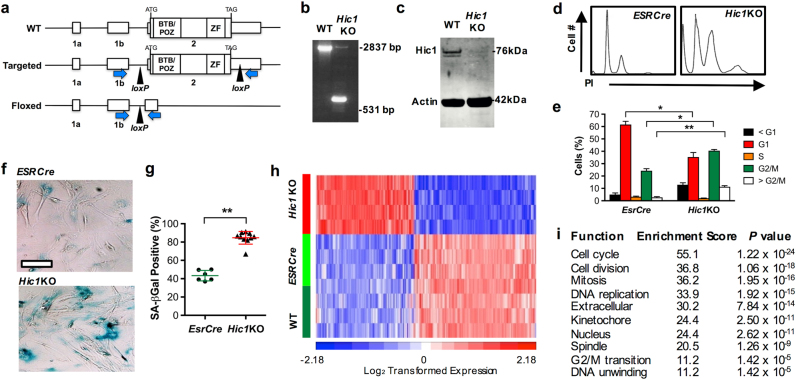
Fig. 1. Conditional deletion of Hic1 in mouse embryonic fibroblasts (MEFs).
Experiments in this Figure were analyzed by an unblinded observer unless otherwise stated. Female mice used in this study were housed under SPF conditions with a standard day/night cycle and fed ad libitum on a pure C57Bl6 background following approval by the Monash Animal Ethics Committee (MMCA/2012/23; MMCA/2012/24; MMCA/2013/26) in accordance with current National Health and Medical Research Council guidelines. All mice were obtained from Jackson Laboratories except for the conditional Hic1lox/lox transgenic line, which was generated by Ozgene (Perth, WA, Australia). Genotyping was performed with Jackson Laboratory protocols except for the Hic1lox/lox line which was genotyped using primers as follows: Fwd 5′-cgcagaccacgcacttcct-3′, Rev 5′-cccaggctaaggcactaaacag-3′, 486 wt; 312 mutant. MEFs were generated and cultured as described [65]. a Targeting strategy, showing exons 1a, 1b and 2 and loxP sites in the wild type (WT), targeted and floxed locus following Cre-mediated excision. PCR primers to detect excision of exon 2 are shown as blue arrows. Primers: Fwd 5′- caacctgtacgtgtgcatcc-3′ and Rev 5′- cagctaaagttgggctcagg-3′. b Genomic PCR using the primers indicated in Fig. 1a. from wild type (WT) or EsrCre-Hic1lox/lox (Hic1KO) MEFs treated with tamoxifen to induce Cre-mediated recombination. c Western blot analysis of Hic1 and Actin expression in MEF cell lysates from the same experiment shown in Fig. 1b. To generate the Hic1 antibody, full length human HIC1 was cloned into the pET-15b vector and soluble recombinant full length HIC1 protein. Antiserum against full length HIC1 protein was raised in rabbits by the Antibody Facility at Flinders University of South Australia. Hic1 antibodies were purified from serum using a NAb Protein A Plus Spin Kit (Thermo Scientific, Waltham, MA, USA, #89978). Validation experiments relating to this antibody are shown in Supplementary Fig. S1. The Actin antibody was obtained from Abcam, Cambridge, UK (#abactn05). d Representative DNA histograms from EsrCre and Hic1KO MEFs 48 h following treatment with tamoxifen. e Quantitiative analysis of the data shown in Fig. 1f. n = 4, mean + SEM, **P < 0.01, *P < 0.05, one-way ANOVA with Bonferonni correction. Cell cycle analysis and sample sizewas performed as described [66, 67]. f Phase contrast photomicrographs of senescence-associated β-Galactosidase (β-Gal) staining in EsrCre or EsrCre-Hic1lox/lox (Hic1KO) MEFs 5 days following tamoxifen treatment. Scale bar = 50 μm. Cells were stained and scored by an observed blinded to the MEF genotype as described [68]. g Quantitative assessment of β-Gal staining in the same experiment shown in Fig. 1h. n = 5–10, **P < 0.01 unpaired t-test. h A heat map depicting differentially expressed genes from preimmortal wild type (WT), EsrCre and Hic1KO MEFs 48 h following treatment with tamoxifen, performed by the Australia Genome Research Facility (Melbourne, VIC, Australia) using the MouseWG-6 v2.0 Expression BeadChip (Illumina, San Diego, CA, USA) as previously described [69]. Detailed bioinformatic methods are described in Supplementary Information. Array data are available through GEO, GSE104394. i Gene ontology analysis of differentially expressed genes in Hic1KO MEFs compared with WT and EsrCre MEFs 2 days following tamoxifen treatment

