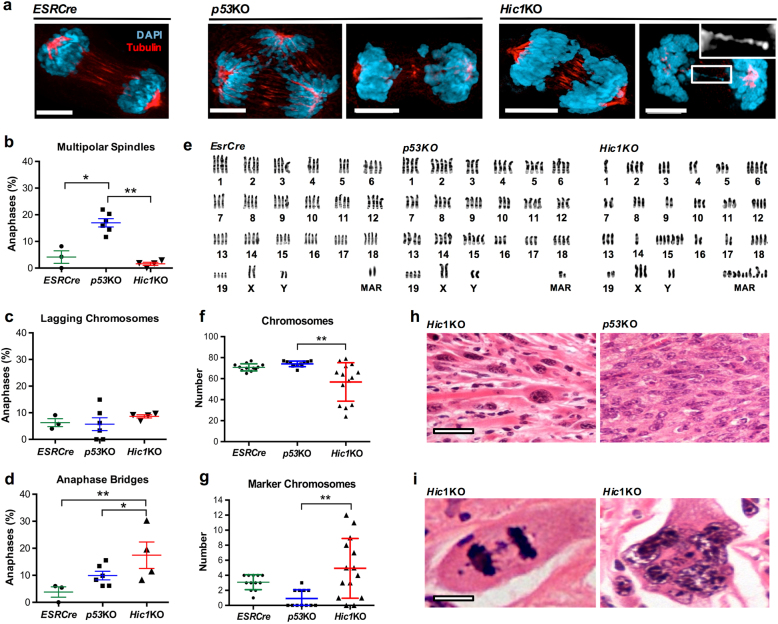
Fig. 3. Deletion of Hic1 results in chromosomal instability.
a Representative confocal photomicrographs showing anaphases in MEFs with the genotypes indicated. Cells were stained for tubulin (Red) and DNA (DAPI) (Blue) as described [66]. Scale bar = 5 μm. Anaphases in cell culture were scored as described previously by an observer blinded to the MEF genotype [66]. b–d Quantitative analysis of aberrant anaphase events in MEFs with the genotypes from the same experiment shown in Fig. 1a, n = 3 (ESRCre), 6 (p53KO) and 4 (Hic1KO) cell lines, average of 55 anaphases per cell line. Mean+SEM. *P < 0.05; **P < 0.01, one-way ANOVA with Bonferonni correction. Sample size was chosen by the number of available MEF lines. e Examples of karyotypes from immortalized MEFs with the genotypes shown. Karyotyping was performed as previously described [70]. f, g Quantification of chromosome number and the number of marker chromosomes, n = 4 ESRCre, n = 6 p53KO and n = 5 Hic1KO cell lines, average of 15 metaphase cells per genotype. **P < 0.01, one-way ANOVA with Bonferonni correction. h Representative photomicrographs of hematoxylin and eosin (H&E) stained sections from formalin-fixed, paraffin-embedded nude mouse allograft tumors with the genotypes indicated. Scale bar = 20 μm. i Representative high-powered photomicrographs of H&E stained sections of Hic1KO nude mouse allograft tumors. Scale bar = 5 μm. MAR marker chromosomes

