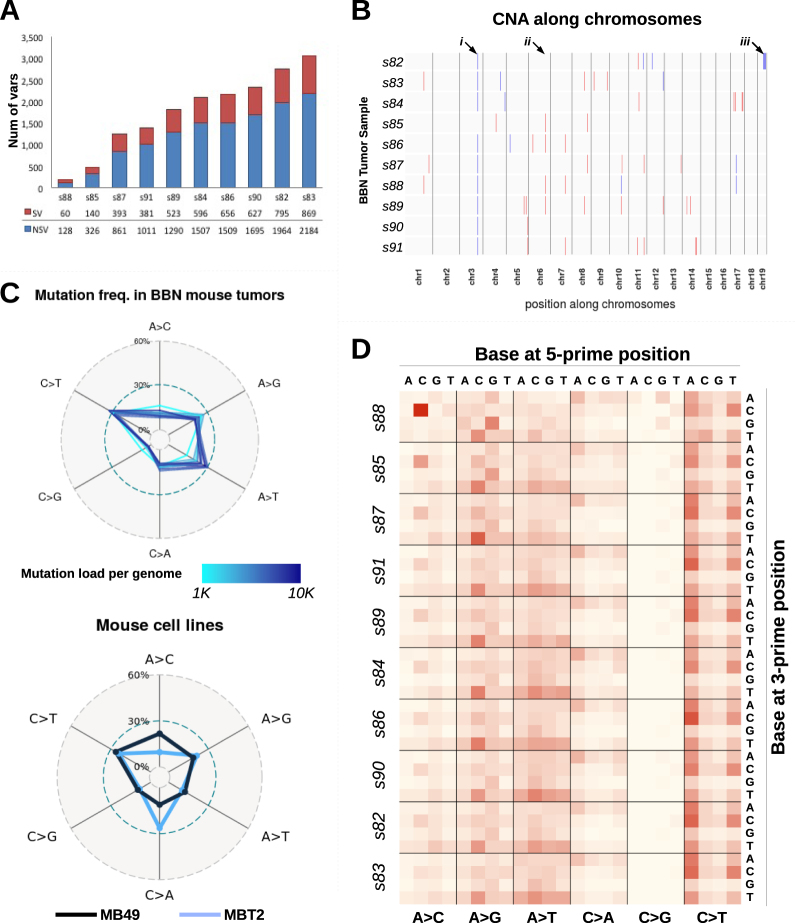
Fig. 2.
Mutation profiles of BBN bladder tumors. a All mice (n = 10) treated with BBN for 20 weeks developed bladder tumors. After sacrifice, genomic DNA was extracted from the tumor-containing bladders, and then submitted for sequencing. Bars indicate the number of variants identified in each mouse tumor, including both synonymous (SV, red) and non-synonymous (NSV, blue) mutations. b Plot summarizing copy number alterations (CNA) identified in the BBN tumor genomes by Control-FREEC analysis. Blue regions indicate DNA losses, red regions indicate DNA gains. Major or consistent CNA are highlighted by arrows: (i) chr3: affecting Sec24d gene; (ii) chr6: affecting Slc6a11 gene; (iii) a shallow deletion of chr19qC3 was detected in only one tumor, s82. c Frequencies of nucleotide conversion for each BBN tumor (top) and two mouse bladder cell lines (bottom) are displayed in the radar charts. Line color corresponds to mutation load (top) or identifies the cell line (bottom). d Frequency of nucleotide conversions within the tri-nucleotide context is displayed in the heat map. Conversions are grouped by mutation type (A>C, A>G, A>T, C>A, C>G, C>T), with different 5′ bases organized column-wise and 3′ bases organized row-wise. Samples are ordered according to mutation load, revealing specific mutations that are directly (i.e., N[A>T]T) or inversely (i.e., C[A>C]C, G[A>G]G) correlated with mutation load

