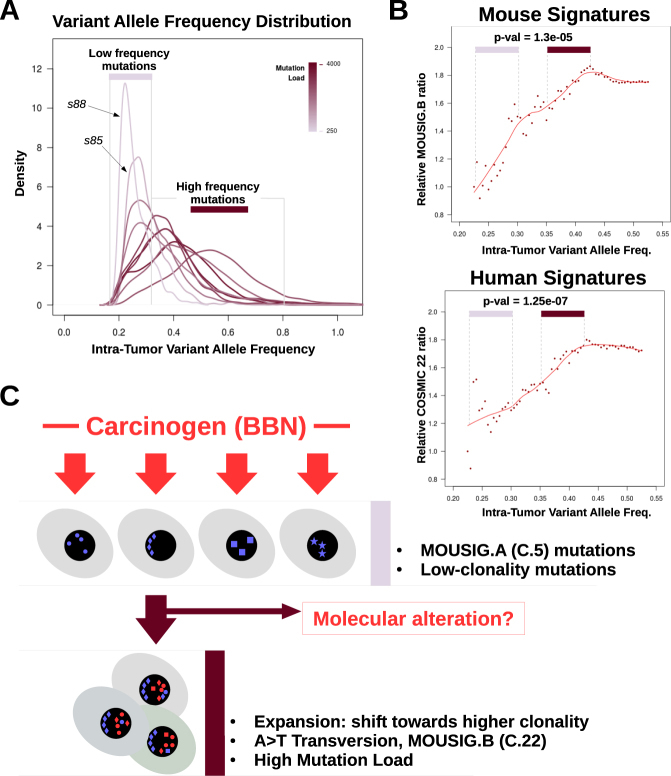
Fig. 4.
Relationship between mutation load and intra-tumor variant allele frequencies in BBN tumors. a Density plot showing the distributions of intra-tumor variant frequencies for each BBN tumor. Peaks shifting toward the right side of the x-axis indicate accumulation of mutations that are shared by a larger fraction of cancer cells in the tumor (clonal expansion). Line color corresponds to mutation load. Area under the curve (AUC) of each line was set to unity. b Scatterplot showing the relative abundance of MOUSIG-B (top) or COSMIC-22 (bottom) signatures as function of the intra-tumor variant allele frequency. Points in the frequency ranges of 0.225–0.300 (low frequency mutations) and 0.350–0.425 (high frequency mutations) were compared via t-test, and p-values were 1.3e-05 and 1.27e-07, respectively. Trendlines were computed using LOESS (red lines). c Diagram summarizing the hypothesized model that may explain genetic instability in the BBN model. Geometric shapes represent mutations acquired as consequence of processes linked to MOUSIG-A (blue) and MOUSIG-B (red) mutational signatures

