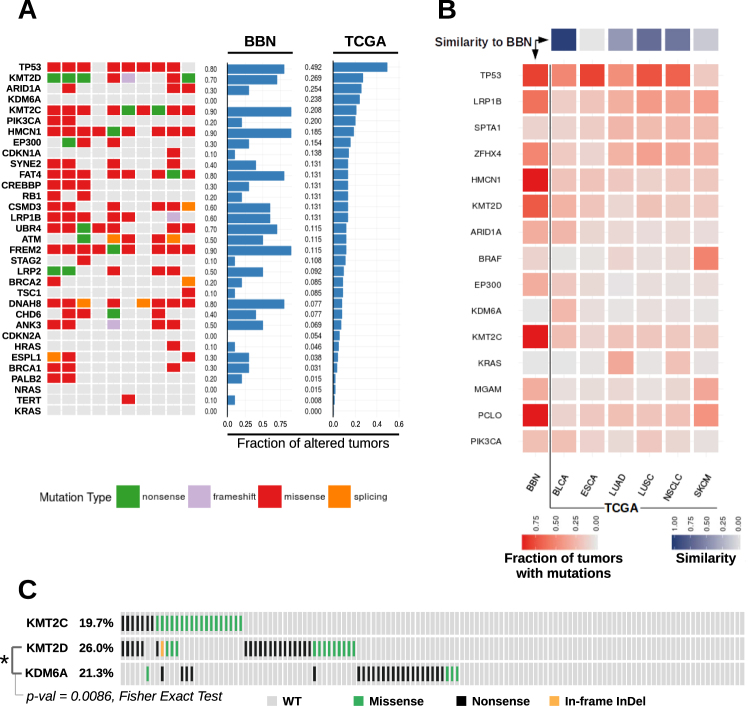
Fig. 5.
Bladder cancer gene mutations across BBN and human tumors. a Tile chart displaying cancer gene alterations in 10 BBN tumor genomes (green, nonsense; purple, frameshift; red, missense; orange splicing site; gray, no mutation). Overall gene mutation rates from the BBN dataset and the human TCGA bladder cancer dataset are displayed in the barplots. b TCGA datasets with overall mutation rates comparable to MIBC were analyzed (BLCA bladder cancer, ESCA Esophageal Carcinoma, LUAD lung adenocarcinoma, LUSC Lung Squamous Cell Carcinoma, NSCLC Non-Small-Cell Lung Cancer, SKCM melanoma). Mutation rates were computed for each tumor type and for each of the 15 genes having the highest overall mutation frequency in the six datasets. Central heatmap displaying mutation rates by gene (rows) across the BBN dataset and TCGA datasets (columns). Square color (red) intensity denotes mutation rate. Top: similarity scores of each TCGA dataset to the BBN dataset were computed as [1— (scaled Canberra distance)] and are displayed via a 1-row heatmap. Square color (purple) intensity denotes the relative similarity to the BBN profile. c Variants occurring in the KMT2C, KMT2D and KDM6A genes in the human bladder cancer TCGA dataset, visualized by oncoprint format. Mutual exclusivity of KMT2D and KDM6A mutations was tested via Fisher Exact Test (p-value = 0.0086)

