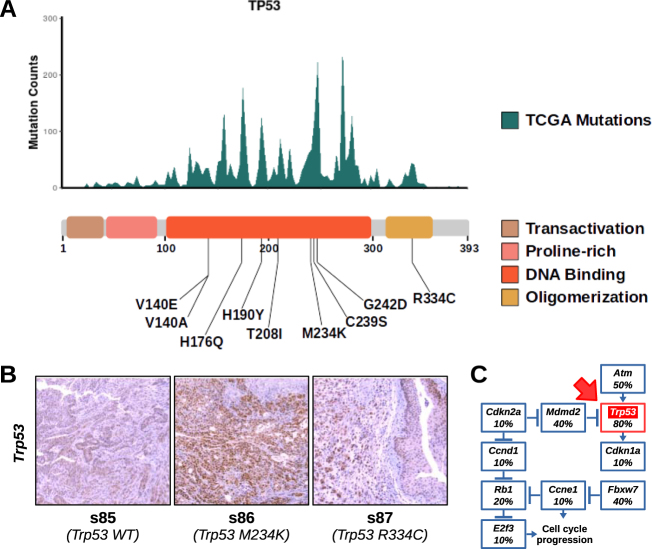
Fig. 6.
Trp53 mutations in BBN tumors. a Top. Histogram displaying TP53 hotspot mutations from aggregate TCGA genomes (missense, frameshift, and nonsense mutations were included). Bottom. List of variants found in Trp53 mapped to a diagram of the functional domains of the protein. b IHC for Trp53 was performed on tissue sections from normal bladders or BBN tumors expressing wild type (left) or mutant (M234K, center; R334C, right) Trp53. c Diagram displaying the frequency of tumors with mutations in different genes belonging to the Trp53 pathway. Trp53 box is highlighted in red (red arrow)

