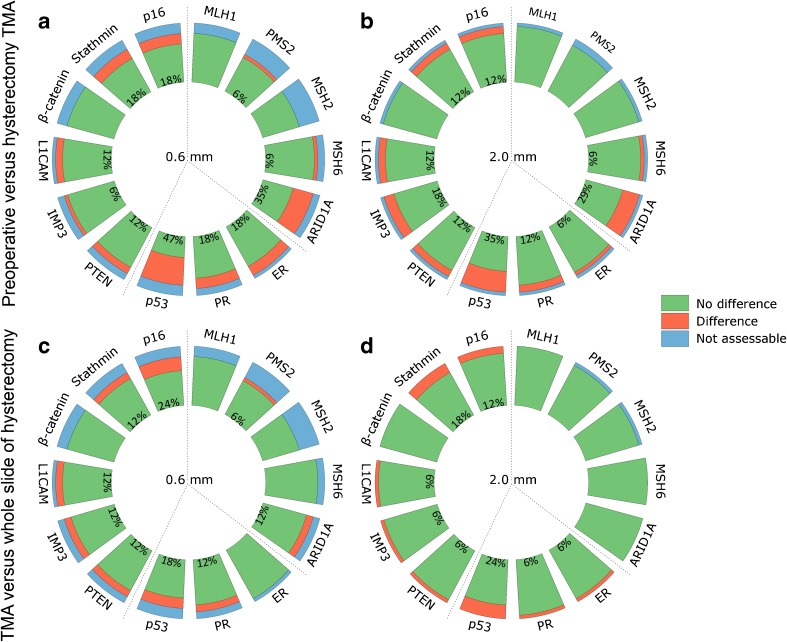
Fig. 2.
Preoperative versus hysterectomy TMA for 0.6 mm (a) and 2.0 mm (b) and TMA versus whole slide of hysterectomy for 0.6-mm (c) and 2.0-mm cores (d). Green indicates no difference, red indicates difference, and blue indicates not assessable cores. Percentages represent the percentage of cores with a difference between respespectively preoperative and hysterectomy TMA score and between TMA and whole slide of hysterectomy

