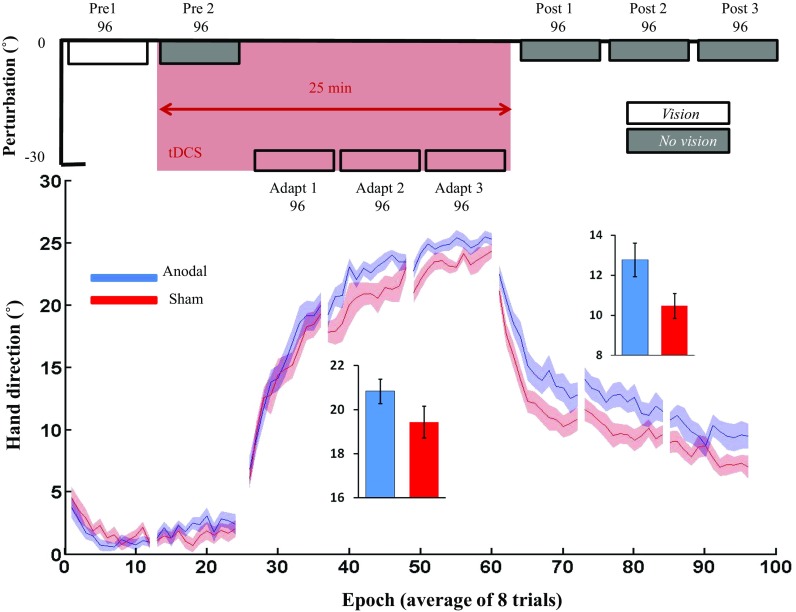
Fig. 4.
Influence of cerebellar tDCS on visuomotor adaptation. Epoch data (average across 8 trials) for angular hand direction (˚) for the anodal (blue) and sham cerebellar tDCS groups. Positive values indicate CW hand direction. The inset bar graphs indicate mean hand direction for the anodal and sham groups during adaptation (adapt 1–3) and retention (post-1–3). Solid lines, mean; shaded areas/error bars, S.E.M

