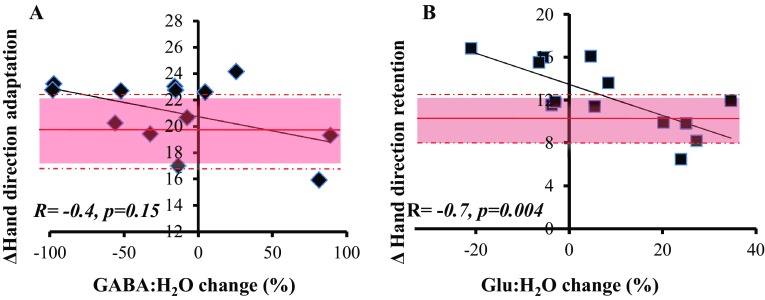
Fig. 6.
Correlations between MRS and visuomotor adaptation. a There was no significant correlation between the changes in the GABA:H20 ratio during cerebellar tDCS and total adaptation. The red line represents the sham group’s mean performance during total adaptation (shaded area = SD across group). b A significant negative correlation was observed between changes in the Glu:H2O ratio during cerebellar tDCS and total retention. The red line represents the sham group’s mean performance during total retention (shaded area = SD across group)

