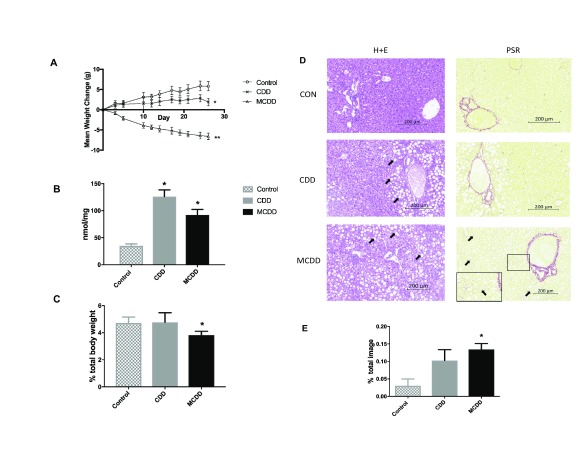
Figure 1. Body weight and hepatic lipid content.
A) In comparison with control animals, mice on CDD gain less weight whereas those on MCDD lose weight. B) Hepatic liver triglyceride content was increased on both CDD and MCDD diets. C) Liver weight was reduced in MCDD fed mice but not CDD. D) Liver histology from control, CDD and MCDD mice. H+E = Hematoxylin and Eosin staining showing marked macrovesicular steatosis in both CDD and MCDD mice (white arrows). PSR = Picosirius Red stain staining for new collagen formation showing increased periportal and interstitial fibrosis in MCDD animals (black arrows). In MCDD liver stained with PSR, insert at higher magnification shows increased fibrosis more clearly. E) Quantified fibrosis content (PSR positive staining as a percentage of entire image). n = 10 per group for all figures. * P < 0.05 ** P < 0.01 (one way ANOVA with Tukey post hoc test versus control animals). Error bars = +/- SEM.

