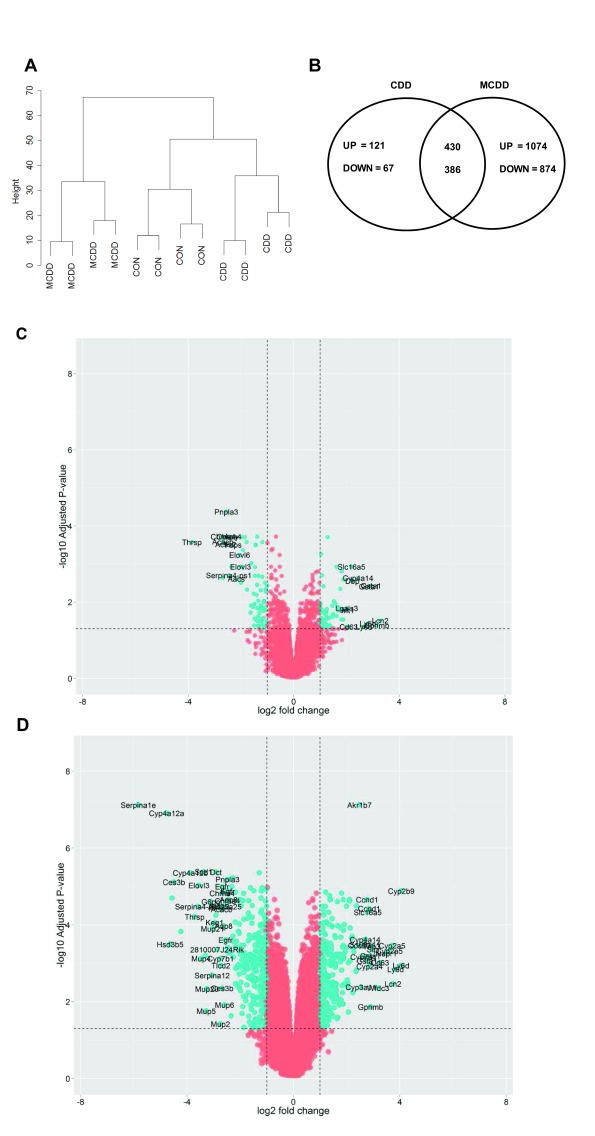
Figure 2. Differential gene expression.
A) Transcript profiles of each dietary intervention were sufficiently consistent to cluster by Euclidean distance. B) Venn diagram demonstrating high degree of overlap in dysregulated transcripts (≥2 fold change) in each group and the direction of transcriptional change. C and D) Volcano plots demonstrating transcriptional changes in CDD ( C) and MCDD ( D) mice. Dotted lines and blue colour represent adjusted P values < 0.05 and two fold differential expression change.

