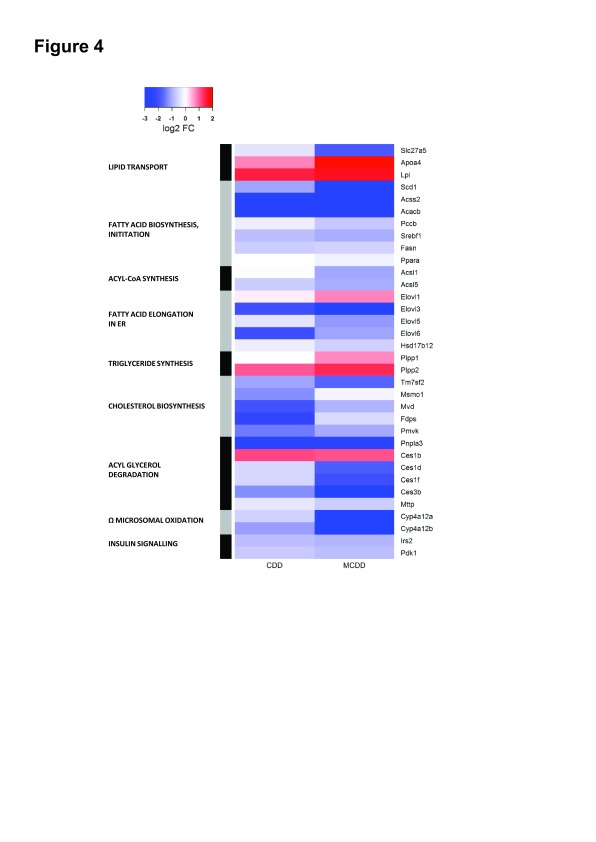
Figure 4. Heatmap depiction of expression changes in KEGG pathways of lipid transport, lipid synthesis and degradation and insulin signalling.
Up- and down-regulated genes in each dietary intervention versus control animals are demonstrated by colour key. Pathways of lipid and cholesterol synthesis are globally suppressed.

