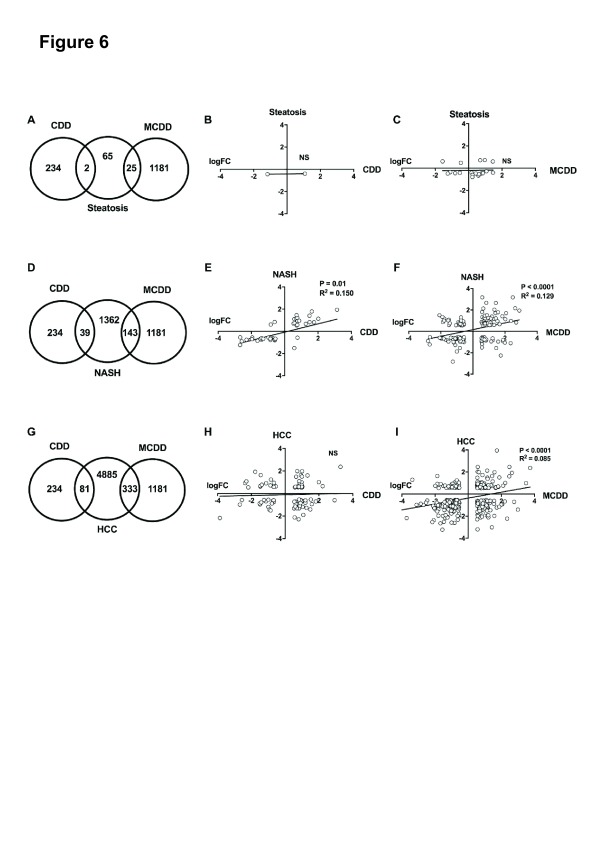
Figure 6. Cross-species comparison of CDD and MCDD transcriptional changes with human stages of NAFLD.
Venn diagrams showing common and distinct dysregulated gene orthologues between CDD and MCDD livers and human hepatic steatosis ( A), human NASH ( D) and human HCC ( G). Scatter plots demonstrate Log2 fold change in common dysregulated orthologues between CDD and MCDD mouse livers and corresponding orthologues in human steatosis ( B+ C), human NASH ( E+ F) and human HCC ( H+ I). Trend line, P value and R 2 value calculated by linear regression analysis.

