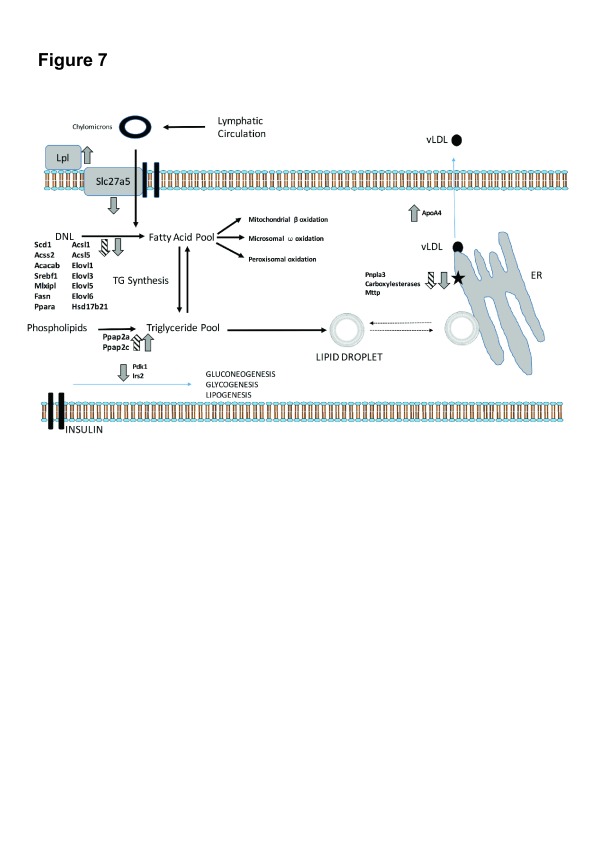
Figure 7. Transcriptional dysregulation mapped to pathways of lipid transport and metabolism in hepatocytes.
Arrows demonstrate direction of transcriptional change in CDD (hatched) and MCDD (grey) diets. Pnpla3 and Ces suppression suggest impaired packaging of lipid into VLDL particles on the surface of the ER (black star), which may represent a novel site of lipid accumulation.

