. 2017 Dec 11;9(5):1279–1288. doi: 10.1039/c7sc04521b

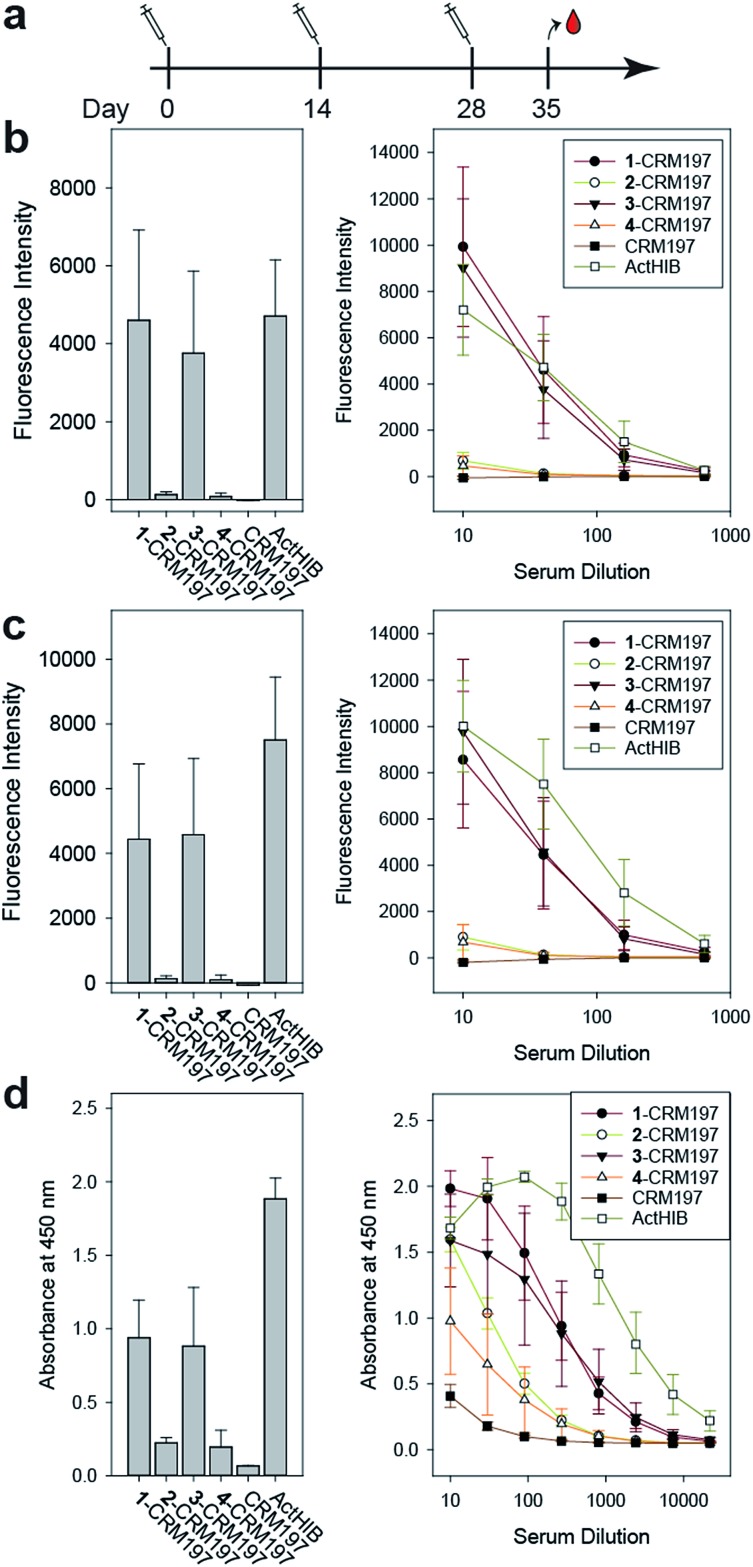
Fig. 5. Immunization of rabbits with sPRP glycoconjugates, CRM197 negative control and ActHIB positive control. (a) Prime-boost immunization regime. Each dose contained 5 μg PRP. (b) IgG response to Hib RU dimer S4 as determined by glycan array. Bar chart (left): response measured with serum diluted 1 : 40. Line plot (right): dilution-response series. (c) IgG response towards Hib RU decamer 4 as determined by glycan array. Charts as in (b). See ESI Fig. S4a–c for antibody response toward 1–3 as determined by glycan array. (d) IgG response towards native Hib PRP measured by ELISA. Bar chart (left): response measured with serum diluted 1 : 270. Line plot (right): dilution–response series (b–d) each data point represents the mean of four animals with error bars representing the standard error of the mean (SEM).

Fig. 5