
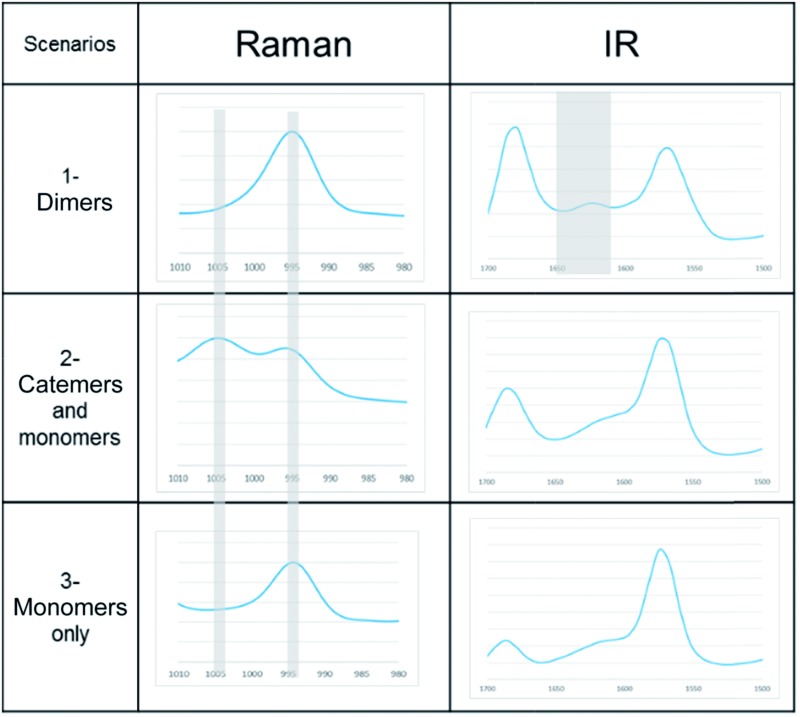
Table 2. Solution properties and corresponding crystallization outcomes. The Raman and IR spectra in the bottom table are from [Emim][N(CN)2], [OHEmim][BF4], and [Emim][BF4] respectively as they represent the patterns in the described scenarios.
| Scenarios | Spectroscopic characteristics | Solvents for INA | Solids obtained |
| 1-Dimers | Raman peak at 995 cm–1, IR peak at 1620–1640 cm–1 | [Emim][OAC] | N/A |
| [Emim][N(CN2)] | IV | ||
| 2-Catemers and monomers | Raman peak at both 995 and 1005 cm–1, no distinct IR peak at 1620–1640 cm–1 | [OHEmim][BF4] | N/A |
| [OHEmim][NTf2] | III | ||
| 3-Monomers only | Raman peak at both 995 cm–1, no IR peak at 1620–1640 cm–1 | [Emim][BF4] | III |
| [Emim][NTf2] | III |
|