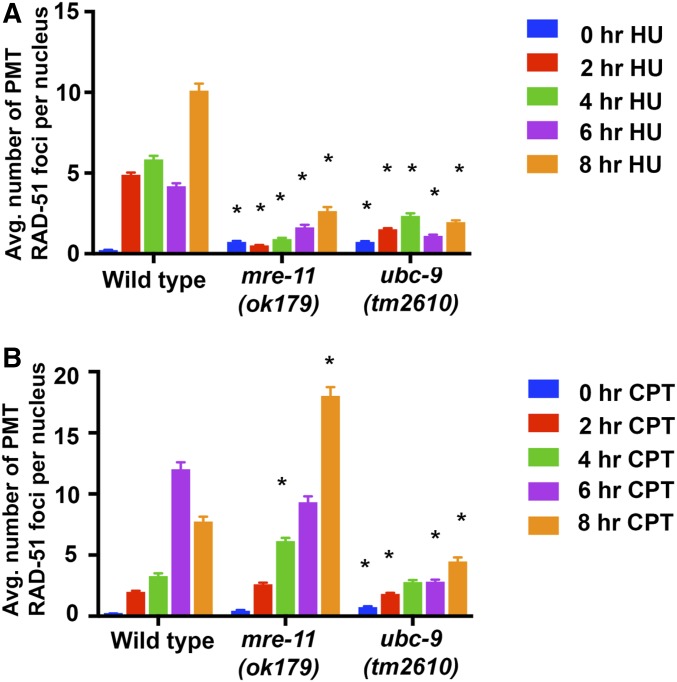
Figure 6.
ubc-9(tm2610) and mre-11(ok179) mutants show defects in average (Avg.) RAD-51 recruitment following HU (hydroxyurea) and CPT (camptothecin) exposure in premeiotic tip (PMT) nuclei. (A) Graph of RAD-51 foci counts after 5.25 mM HU exposure over an 8-hr period. Controls were not exposed to any chemical. At least three PMTs were counted per genotype (826–1626 total PMT nuclei counted per treatment). Stars indicate P < 0.05 compared to wild-type at the equivalent time-point (Mann–Whitney U test). Other pairwise comparisons can be found in supplemental tables. (B) Graph of RAD-51 foci counts after 350 nM CPT exposure over an 8-hr period. Three to eight PMTs were counted in each of the time-points and for each genotype (668–1719 total PMT nuclei counted per treatment). Error bars signify the mean ± SEM. Stars indicate P < 0.05 compared to wild-type at the equivalent time-point (Mann–Whitney U test).

