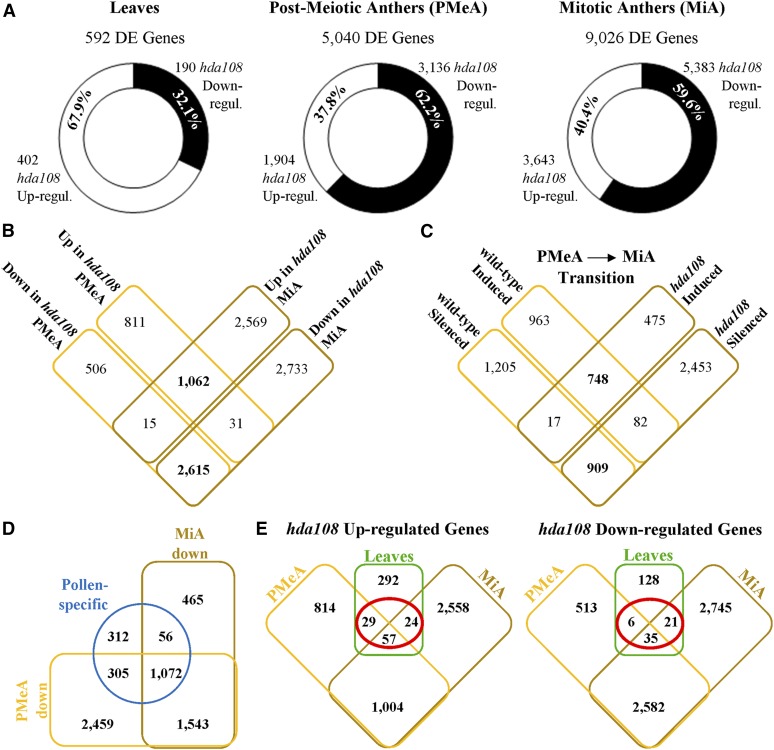
Figure 4.
Summary of hda108 differentially expressed genes. (A) Number and proportion of differentially expressed genes in hda108 mutant leaf and anther at postmeiotic (PMeA) and mitotic (MiA) stages. (B) Venn diagram representing the shared and unique differentially expressed genes in hda108 mutant PMeA and MiA. (C) Venn diagram representing the shared and unique genes induced (log2FC > 1; FDR < 0.05) or silenced (log2FC < −1; FDR < 0.05) during transition from PMeA and MiA in wild-type and hda108 mutant. (D) Venn diagram representing the proportion of pollen-specific genes identified by Chettoor et al. (2014) and down-regulated in hda108 mutant PMeA and MiA compared to wild type. (E) Venn diagrams representing the shared and unique differentially expressed genes in hda108 mutant leaves, and postmeiotic (PMeA) and mitotic (MiA) anthers.

