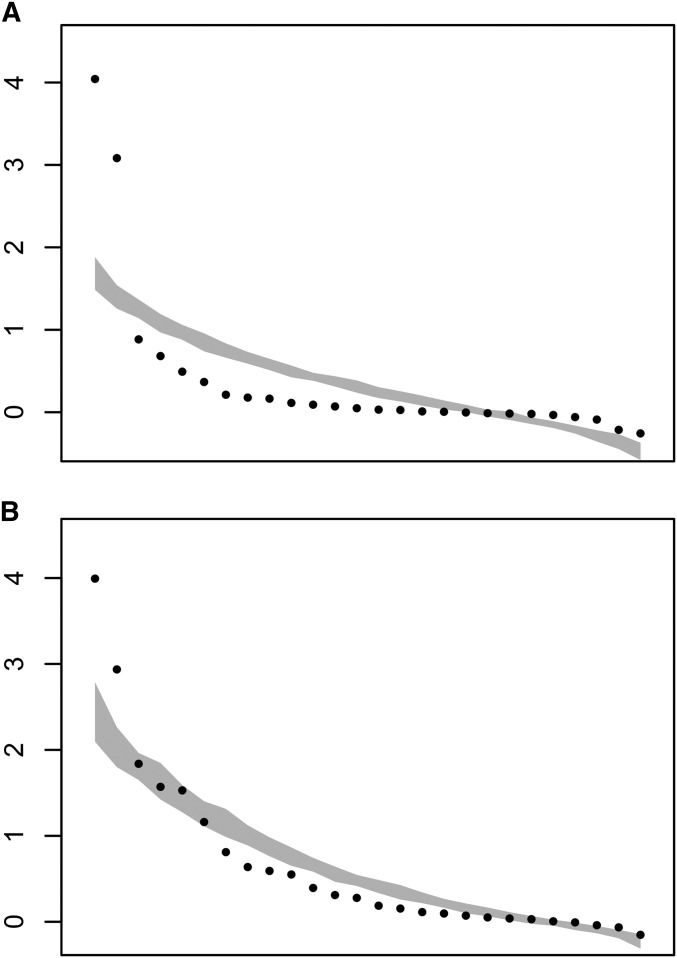
Figure 2.
Spectral distribution of the mutational variance contained in M26 (A) and G26 (B) (see Table 2). The dots are the variances associated with each eigenvector in a descending order. The gray shaded area represents the 95% C.I. of the 50 simulations estimating sampling error (se).

