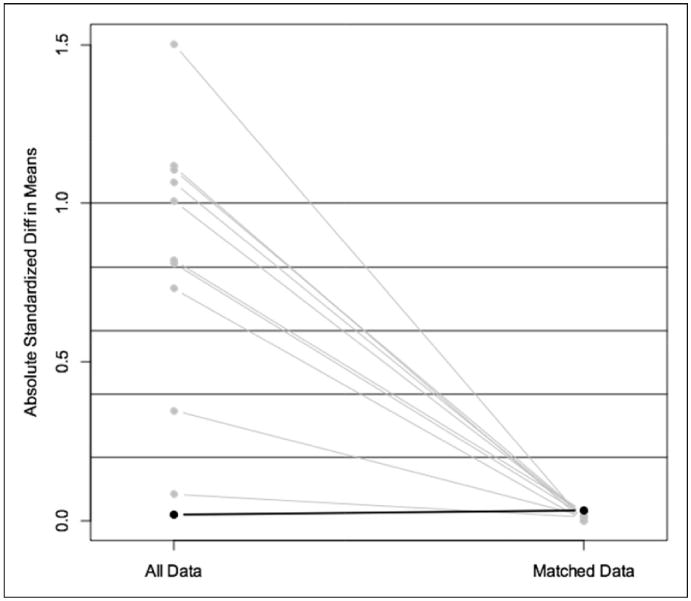
Figure 2.

Absolute standardized differences in means, before and after matching. Note. The plot of the absolute standardized differences in means shows the improvement in balance between Magnet and non-Magnet hospitals, before and after matching. After matching, the individual hospital characteristics each had an absolute standardized difference in means below 0.2, suggesting a good match.
