Fig. 3.

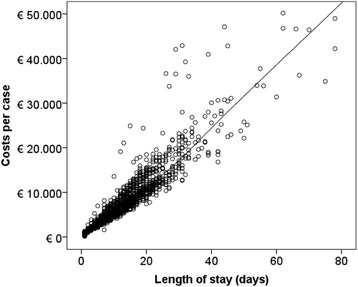
Costs and length of stay per case for group A (n = 2151). Notes: Bivariate relationship of length of stay (LOS) with costs. LOESS fit line serves to smooth scatterplot data. R2 = 0.78

Costs and length of stay per case for group A (n = 2151). Notes: Bivariate relationship of length of stay (LOS) with costs. LOESS fit line serves to smooth scatterplot data. R2 = 0.78